Burger King 2011 Annual Report Download - page 99
Download and view the complete annual report
Please find page 99 of the 2011 Burger King annual report below. You can navigate through the pages in the report by either clicking on the pages listed below, or by using the keyword search tool below to find specific information within the annual report.-
 1
1 -
2
-
3
-
4
-
5
-
6
-
7
-
8
-
9
-
10
-
11
-
12
-
13
-
14
-
15
-
16
-
17
-
18
-
19
-
20
-
21
-
22
-
23
-
24
-
25
-
26
-
27
-
28
-
29
-
30
-
31
-
32
-
33
-
34
-
35
-
36
-
37
-
38
-
39
-
40
-
41
-
42
-
43
-
44
-
45
-
46
-
47
-
48
-
49
-
50
-
51
-
52
-
53
-
54
-
55
-
56
-
57
-
58
-
59
-
60
-
61
-
62
-
63
-
64
-
65
-
66
-
67
-
68
-
69
-
70
-
71
-
72
-
73
-
74
-
75
-
76
-
77
-
78
-
79
-
80
-
81
-
82
-
83
-
84
-
85
-
86
-
87
-
88
-
 89
89 -
 90
90 -
 91
91 -
 92
92 -
 93
93 -
 94
94 -
 95
95 -
 96
96 -
 97
97 -
 98
98 -
 99
99 -
 100
100 -
 101
101 -
 102
102 -
 103
103 -
 104
104 -
 105
105 -
 106
106 -
 107
107 -
 108
108 -
 109
109 -
110
-
111
-
112
-
113
-
114
-
115
-
116
-
117
-
118
-
119
-
120
-
121
-
122
-
123
-
124
-
125
-
126
-
127
-
128
-
129
-
130
-
131
-
132
-
133
-
134
-
135
-
136
-
137
-
138
-
139
-
140
-
141
-
142
-
143
-
144
-
145
-
146
-
147
-
148
-
149
-
150
-
151
-
152
 |
 |

Table of Contents
BURGER KING HOLDINGS, INC. AND SUBSIDIARIES
Notes to Consolidated Financial Statements — (Continued)
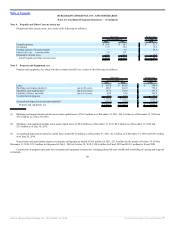
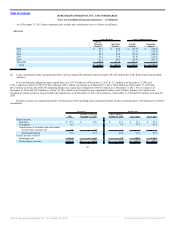
As of December 31, 2011, future minimum lease receipts and commitments were as follows (in millions):
Successor
Lease Receipts Lease Commitments(a)
Direct
Financing
Leaes
Operating
Leases
Capital
Leases
Operating
Leases
2012 $ 30.7 $ 66.8 $ (17.5) $ (146.8)
2013 30.1 62.7 (17.6) (136.8)
2014 29.4 56.5 (17.0) (125.6)
2015 29.2 53.0 (15.8) (115.9)
2016 28.5 48.6 (14.4) (107.7)
Thereafter 170.6 333.9 (75.3) (613.2)
Total $ 318.5 $ 621.5 $ (157.6) $ (1,246.0)
(a) Lease commitments under operating leases have not been reduced by minimum sublease rentals of $318.0 million due in the future under noncancelable
subleases.
Our total minimum obligations under capital leases are $157.6 million as of December 31, 2011, $175.1 million as of December 31, 2010 and
$134.1 million as of June 30, 2010. Of these amounts, $52.9 million was interest as of December 31, 2011, $62.0 million as of December 31, 2010 and
$63.2 million as of June 30, 2010. The remaining balance was capital lease obligations of $104.7 million as of December 31, 2011, $113.1 million as of
December 31, 2010 and $70.9 million as of June 30, 2010 which are all recorded on our consolidated balance sheet. Of these balances, $9.3 million was
classified as current portion of long-term debt and capital leases as of December 31, 2011, $9.2 million as of December 31, 2010 and $5.6 million as of June 30,
2010.
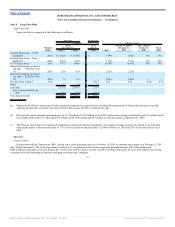
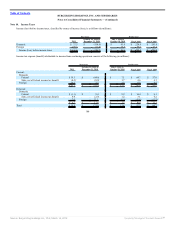
Property revenues are comprised primarily of rental income from operating leases and earned income on direct financing leases with franchisees as follows
(in millions):
Successor Predecessor
2011
October 19, 2010 to
December 31, 2010
July 1, 2010 to
October 18, 2010
Fiscal 2010 Fiscal 2009
Rental income:
Minimum $ 72.9 $ 16.0 $ 21.9 $ 73.1 $ 69.9
Contingent 0.3 — 4.9 17.9 20.6
Amortization of favorable and unfavorable
income lease contracts, net 6.6 1.3 — — —
Total rental income 79.8 17.3 26.8 91.0 90.5
Earned income on direct
financing leases 31.4 6.2 7.2 22.7 23.0
Total property revenues $ 111.2 $ 23.5 $ 34.0 $ 113.7 $ 113.5
98
Source: Burger King Holdings Inc, 10-K, March 14, 2012 Powered by Morningstar® Document Research℠