Burger King 2011 Annual Report Download - page 43
Download and view the complete annual report
Please find page 43 of the 2011 Burger King annual report below. You can navigate through the pages in the report by either clicking on the pages listed below, or by using the keyword search tool below to find specific information within the annual report.-
 1
1 -
2
-
3
-
4
-
5
-
6
-
7
-
8
-
9
-
10
-
11
-
12
-
13
-
14
-
15
-
16
-
17
-
18
-
19
-
20
-
21
-
22
-
23
-
24
-
25
-
26
-
27
-
28
-
29
-
30
-
31
-
32
-
 33
33 -
 34
34 -
 35
35 -
 36
36 -
 37
37 -
 38
38 -
 39
39 -
 40
40 -
 41
41 -
 42
42 -
 43
43 -
 44
44 -
 45
45 -
 46
46 -
 47
47 -
 48
48 -
 49
49 -
 50
50 -
 51
51 -
 52
52 -
 53
53 -
54
-
55
-
56
-
57
-
58
-
59
-
60
-
61
-
62
-
63
-
64
-
65
-
66
-
67
-
68
-
69
-
70
-
71
-
72
-
73
-
74
-
75
-
76
-
77
-
78
-
79
-
80
-
81
-
82
-
83
-
84
-
85
-
86
-
87
-
88
-
89
-
90
-
91
-
92
-
93
-
94
-
95
-
96
-
97
-
98
-
99
-
100
-
101
-
102
-
103
-
104
-
105
-
106
-
107
-
108
-
109
-
110
-
111
-
112
-
113
-
114
-
115
-
116
-
117
-
118
-
119
-
120
-
121
-
122
-
123
-
124
-
125
-
126
-
127
-
128
-
129
-
130
-
131
-
132
-
133
-
134
-
135
-
136
-
137
-
138
-
139
-
140
-
141
-
142
-
143
-
144
-
145
-
146
-
147
-
148
-
149
-
150
-
151
-
152
 |
 |

Table of Contents
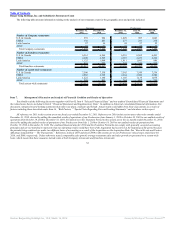
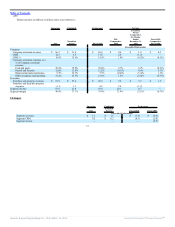
Selling, general and administrative expenses
Our selling, general and administrative expenses were comprised of the following:
Predecessor Variance
Fiscal 2010 Fiscal 2009 $ %
Selling expenses $ 91.3 $ 93.3 $(2.0) (2.1)%
Management G&A expenses 362.3 362.1 0.2 0.1%
Share-based compensation and non-cash incentive compensation expense 17.0 16.2 0.8 4.9%
Depreciation and amortization 19.2 16.5 2.7 16.4%
Total general and administrative expenses 398.5 394.8 3.7 0.9%
Selling, general and administrative expenses $ 489.8 $ 488.1 $ 1.7 0.3%
Selling expenses as a percentage of Company restaurant revenues were flat in comparison to the prior year.
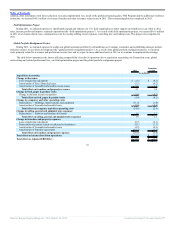
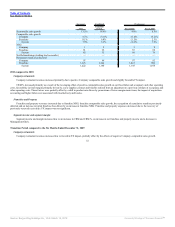
Other operating income (expense), net
Our other operating income (expense), net was comprised of the following:
Predecessor
Fiscal 2010 Fiscal 2009
Net (gains) on disposal of assets, restaurant closures and refranchisings $ (2.4) $ (8.5)
Litigation settlements and reserves, net (0.2) 0.2
Foreign exchange net (gains) losses (3.3) 8.4
Loss (income) from unconsolidated affiliates 0.1 (0.4)
Other, net 5.1 2.2
Other operating (income) expenses, net $ (0.7) $ 1.9
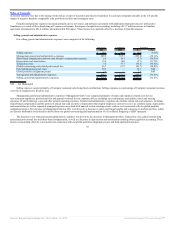
Interest expense, net
Interest expense, net, decreased due to a net decrease in borrowings and interest rates during the period. The weighted average interest rate for Fiscal 2010
was 4.7%, which included the effect of interest rate swaps on an average of 73% of our term debt. The weighted average interest rate Fiscal 2009 was 5.1%,
which included the effect of interest rate swaps on an average of 71% of our term debt.
Income tax expense
Our effective tax rate was 34.3% in Fiscal 2010 compared to 29.7% in Fiscal 2009 primarily due to the resolution of certain federal and state audits and
realized tax benefits from the dissolution of dormant foreign entities.
42
Source: Burger King Holdings Inc, 10-K, March 14, 2012 Powered by Morningstar® Document Research℠