Burger King 2011 Annual Report Download - page 102
Download and view the complete annual report
Please find page 102 of the 2011 Burger King annual report below. You can navigate through the pages in the report by either clicking on the pages listed below, or by using the keyword search tool below to find specific information within the annual report.-
 1
1 -
2
-
3
-
4
-
5
-
6
-
7
-
8
-
9
-
10
-
11
-
12
-
13
-
14
-
15
-
16
-
17
-
18
-
19
-
20
-
21
-
22
-
23
-
24
-
25
-
26
-
27
-
28
-
29
-
30
-
31
-
32
-
33
-
34
-
35
-
36
-
37
-
38
-
39
-
40
-
41
-
42
-
43
-
44
-
45
-
46
-
47
-
48
-
49
-
50
-
51
-
52
-
53
-
54
-
55
-
56
-
57
-
58
-
59
-
60
-
61
-
62
-
63
-
64
-
65
-
66
-
67
-
68
-
69
-
70
-
71
-
72
-
73
-
74
-
75
-
76
-
77
-
78
-
79
-
80
-
81
-
82
-
83
-
84
-
85
-
86
-
87
-
88
-
89
-
90
-
91
-
 92
92 -
 93
93 -
 94
94 -
 95
95 -
 96
96 -
 97
97 -
 98
98 -
 99
99 -
 100
100 -
 101
101 -
 102
102 -
 103
103 -
 104
104 -
 105
105 -
 106
106 -
 107
107 -
 108
108 -
 109
109 -
 110
110 -
 111
111 -
 112
112 -
113
-
114
-
115
-
116
-
117
-
118
-
119
-
120
-
121
-
122
-
123
-
124
-
125
-
126
-
127
-
128
-
129
-
130
-
131
-
132
-
133
-
134
-
135
-
136
-
137
-
138
-
139
-
140
-
141
-
142
-
143
-
144
-
145
-
146
-
147
-
148
-
149
-
150
-
151
-
152
 |
 |

Table of Contents
BURGER KING HOLDINGS, INC. AND SUBSIDIARIES
Notes to Consolidated Financial Statements — (Continued)
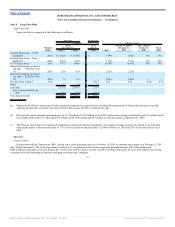
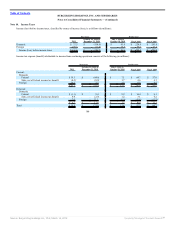
The U.S. Federal tax statutory rate reconciles to the effective tax rate as follows:
Successor Predecessor
2011
October 19, 2010 to
December 31, 2010
July 1, 2010 to
October 18, 2010 Fiscal 2010 Fiscal 2009
U.S. Federal income tax rate 35.0% (35.0)% 35.0% 35.0% 35.0%
State income taxes, net of federal income
tax benefit 1.1 (3.1) 3.0 3.4 2.8
Costs/(Benefits) and taxes related to
foreign operations 11.5 11.3 (2.5) 1.7 (4.7)
Foreign tax rate differential (20.5) 0.1 (8.8) (5.6) (4.9)
Foreign exchange differential on tax
benefits (0.1) 0.2 (0.6) 0.3 0.7
Change in valuation allowance 3.0 3.2 (4.5) (0.6) 1.1
Change in accrual for tax uncertainties 1.4 0.2 (2.6) 0.2 (1.3)
Federal credits (2.0) (0.4) (0.7) (0.7) (1.2)
Deductible FTC (2.9) — — — —
Non Deductible Transaction Costs — 3.5 — — —
Other 0.6 0.2 (0.1) 0.6 2.2
Effective income tax rate 27.1% (19.8)% 18.2% 34.3% 29.7%
Our effective tax rate was 27.1% for 2011, (19.8%) for the period from October 19, 2010 through December 31, 2010 primarily as a result of the current
mix of income from multiple tax jurisdictions and the Transactions. The effective tax rate was 18.2% for the period from July 1, 2010 through October 18, 2010
primarily as a result of the mix of income from multiple tax jurisdictions and the sale of the Netherlands entity.
Our effective tax rate was 34.3% for Fiscal 2010, primarily as a result of the current mix of income from multiple tax jurisdictions and currency
fluctuations, and our effective tax rate was 29.7% for Fiscal 2009, primarily as a result of the resolution of certain federal and state audits and tax benefits
realized from the dissolution of dormant entities.
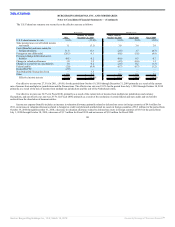
Income tax expense/(benefit) includes an increase in valuation allowance primarily related to deferred tax assets in foreign countries of $4.6 million for
2011, an increase in valuation allowance related to foreign tax credit carryforwards and deferred tax assets in foreign countries of $3.3 million for the period from
October 19, 2010 through December 31, 2010, a decrease in valuation allowance related to deferred tax assets in foreign countries of $3.8 for the period from
July 1, 2010 through October 18, 2010, a decrease of $1.7 million for Fiscal 2010 and an increase of $3.0 million for Fiscal 2009.
101
Source: Burger King Holdings Inc, 10-K, March 14, 2012 Powered by Morningstar® Document Research℠