Burger King 2011 Annual Report Download - page 100
Download and view the complete annual report
Please find page 100 of the 2011 Burger King annual report below. You can navigate through the pages in the report by either clicking on the pages listed below, or by using the keyword search tool below to find specific information within the annual report.-
 1
1 -
2
-
3
-
4
-
5
-
6
-
7
-
8
-
9
-
10
-
11
-
12
-
13
-
14
-
15
-
16
-
17
-
18
-
19
-
20
-
21
-
22
-
23
-
24
-
25
-
26
-
27
-
28
-
29
-
30
-
31
-
32
-
33
-
34
-
35
-
36
-
37
-
38
-
39
-
40
-
41
-
42
-
43
-
44
-
45
-
46
-
47
-
48
-
49
-
50
-
51
-
52
-
53
-
54
-
55
-
56
-
57
-
58
-
59
-
60
-
61
-
62
-
63
-
64
-
65
-
66
-
67
-
68
-
69
-
70
-
71
-
72
-
73
-
74
-
75
-
76
-
77
-
78
-
79
-
80
-
81
-
82
-
83
-
84
-
85
-
86
-
87
-
88
-
89
-
 90
90 -
 91
91 -
 92
92 -
 93
93 -
 94
94 -
 95
95 -
 96
96 -
 97
97 -
 98
98 -
 99
99 -
 100
100 -
 101
101 -
 102
102 -
 103
103 -
 104
104 -
 105
105 -
 106
106 -
 107
107 -
 108
108 -
 109
109 -
 110
110 -
111
-
112
-
113
-
114
-
115
-
116
-
117
-
118
-
119
-
120
-
121
-
122
-
123
-
124
-
125
-
126
-
127
-
128
-
129
-
130
-
131
-
132
-
133
-
134
-
135
-
136
-
137
-
138
-
139
-
140
-
141
-
142
-
143
-
144
-
145
-
146
-
147
-
148
-
149
-
150
-
151
-
152
 |
 |

Table of Contents
BURGER KING HOLDINGS, INC. AND SUBSIDIARIES
Notes to Consolidated Financial Statements — (Continued)
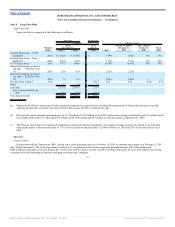
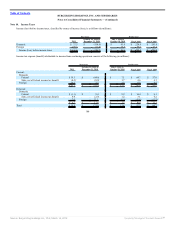
Rent expense associated with the lease commitments is as follows (in millions):
Successor Predecessor
2011
October 19, 2010 to
December 31, 2010
July 1, 2010 to
October 18, 2010
Fiscal 2010 Fiscal 2009
Rental expense:
Minimum $ 167.3 $ 27.8 $ 47.4 $ 168.9 $ 166.5
Contingent 4.5 1.3 2.0 7.4 7.7
Amortization of favorable and unfavorable
payable lease contracts, net (3.4) (0.9) (3.9) (15.0) (18.2)
Total rental expense $ 168.4 $ 28.2 $ 45.5 $ 161.3 $ 156.0
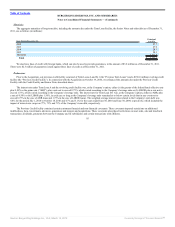
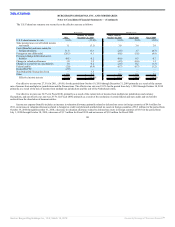
The impact of favorable and unfavorable lease amortization on operating income is as follows (in millions):
Successor Predecessor
2011
October 19,
2010 to
December 31,
2010
July 1, 2010 to
October 18,
2010
Fiscal 2010 Fiscal 2009
Franchise and property revenues $ 6.6 $ 1.3 $ — $ — $ —
Company restaurant expenses:
Occupancy and other operating costs 4.1 1.0 2.6 10.4 12.7
Franchise and property expenses (0.7) (0.1) 1.3 4.6 5.5
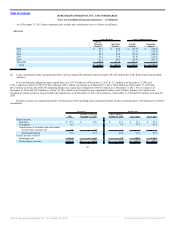
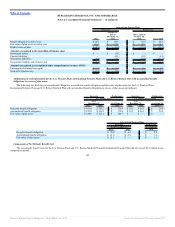
Estimated future amortization expense (benefit) of favorable and unfavorable lease contracts subject to amortization are as follows (in millions):
Company Restaurants
Occupancy and Other Operating
Expenses Franchise and Property Revenue Franchise and Property Expenses
Favorable Unfavorable Favorable Unfavorable Favorable Unfavorable
2012 $ 7.0 $ (10.2) $ 4.8 $ (11.2) $ 5.6 $ (4.9)
2013 6.8 (9.7) 4.4 (10.6) 5.5 (4.7)
2014 6.5 (8.7) 3.9 (10.1) 5.4 (4.1)
2015 5.9 (7.4) 3.4 (9.7) 5.2 (3.5)
2016 5.5 (6.6) 3.1 (9.3) 5.0 (3.2)
Thereafter 28.8 (27.3) 15.4 (46.9) 30.0 (16.1)
Total $ 60.5 $ (69.9) $ 35.0 $ (97.8) $ 56.7 $ (36.5)
99
Source: Burger King Holdings Inc, 10-K, March 14, 2012 Powered by Morningstar® Document Research℠