Burger King 2011 Annual Report Download - page 80
Download and view the complete annual report
Please find page 80 of the 2011 Burger King annual report below. You can navigate through the pages in the report by either clicking on the pages listed below, or by using the keyword search tool below to find specific information within the annual report.-
 1
1 -
2
-
3
-
4
-
5
-
6
-
7
-
8
-
9
-
10
-
11
-
12
-
13
-
14
-
15
-
16
-
17
-
18
-
19
-
20
-
21
-
22
-
23
-
24
-
25
-
26
-
27
-
28
-
29
-
30
-
31
-
32
-
33
-
34
-
35
-
36
-
37
-
38
-
39
-
40
-
41
-
42
-
43
-
44
-
45
-
46
-
47
-
48
-
49
-
50
-
51
-
52
-
53
-
54
-
55
-
56
-
57
-
58
-
59
-
60
-
61
-
62
-
63
-
64
-
65
-
66
-
67
-
68
-
69
-
 70
70 -
 71
71 -
 72
72 -
 73
73 -
 74
74 -
 75
75 -
 76
76 -
 77
77 -
 78
78 -
 79
79 -
 80
80 -
 81
81 -
 82
82 -
 83
83 -
 84
84 -
 85
85 -
 86
86 -
 87
87 -
 88
88 -
 89
89 -
 90
90 -
91
-
92
-
93
-
94
-
95
-
96
-
97
-
98
-
99
-
100
-
101
-
102
-
103
-
104
-
105
-
106
-
107
-
108
-
109
-
110
-
111
-
112
-
113
-
114
-
115
-
116
-
117
-
118
-
119
-
120
-
121
-
122
-
123
-
124
-
125
-
126
-
127
-
128
-
129
-
130
-
131
-
132
-
133
-
134
-
135
-
136
-
137
-
138
-
139
-
140
-
141
-
142
-
143
-
144
-
145
-
146
-
147
-
148
-
149
-
150
-
151
-
152
 |
 |

Table of Contents
BURGER KING HOLDINGS, INC. AND SUBSIDIARIES
Notes to Consolidated Financial Statements — (Continued)
Predecessor operated under a different ownership and capital structure and the application of acquisition accounting affects the comparability of results of
operations for periods before and after the Acquisition. Black lines have been drawn to separate the Successor’s financial information from that of our
Predecessor.
Note 2. Summary of Significant Accounting Policies
Change in Fiscal Year End
On November 5, 2010 the BKH Board of Directors approved a change in fiscal year end from June 30 to December 31. The change became effective at the
end of the quarter ended December 31, 2010. All references to “fiscal years”, unless otherwise noted, refer to the twelve-month fiscal year, which prior to July 1,
2010 ended on June 30.
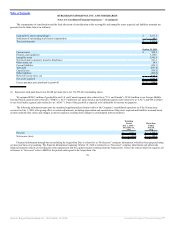
For comparative purposes, Condensed Consolidated Statements of Operations for the Transition Period and six months ended December 31, 2009 are
presented as follows (in millions):
Successor Predecessor
October 19, 2010 to
December 31, 2010
July 1, 2010 to
October 18, 2010
Six Months Ended
December 31, 2009
(Unaudited)
Revenues:
Company restaurant revenues $ 331.7 $ 514.5 $ 946.0
Franchise and property revenues 135.1 203.2 336.3
Total revenues 466.8 717.7 1,282.3
Company restaurant expenses 292.8 444.5 819.6
Franchise and property expenses 21.3 22.2 32.4
Selling, general and administrative expenses 230.0 153.1 254.0
Other operating (income) expenses, net (8.7) (3.6) 5.1
Total operating costs and expenses 535.4 616.2 1,111.1
Income (loss) from operations (68.6) 101.5 171.2
Interest expense, net 58.1 14.6 24.7
Income (loss) before income taxes (126.7) 86.9 146.5
Income tax expense (benefit) (25.1) 15.8 49.7
Net income (loss) $ (101.6) $ 71.1 $ 96.8
Basis of Presentation and Consolidation
The consolidated financial statements include our accounts and our wholly-owned subsidiaries. All material intercompany balances and transactions have
been eliminated in consolidation. Investments in affiliates owned 50% or less are accounted for by the equity method. These investments were not significant as
of December 31, 2011.
Certain prior year amounts in the accompanying Financial Statements and Notes to the Financial Statements have been reclassified in order to be
comparable with the current year classifications. These reclassifications had no effect on previously reported net income (loss).
Concentrations of Risk
Our operations include Company and franchise restaurants located in 81 countries and U.S. territories. Of the 12,512 restaurants in operation as of
December 31, 2011, 1,295 were Company restaurants and 11,217 were franchise restaurants.
79
Source: Burger King Holdings Inc, 10-K, March 14, 2012 Powered by Morningstar® Document Research℠