Burger King 2011 Annual Report Download - page 29
Download and view the complete annual report
Please find page 29 of the 2011 Burger King annual report below. You can navigate through the pages in the report by either clicking on the pages listed below, or by using the keyword search tool below to find specific information within the annual report.-
 1
1 -
2
-
3
-
4
-
5
-
6
-
7
-
8
-
9
-
10
-
11
-
12
-
13
-
14
-
15
-
16
-
17
-
18
-
 19
19 -
 20
20 -
 21
21 -
 22
22 -
 23
23 -
 24
24 -
 25
25 -
 26
26 -
 27
27 -
 28
28 -
 29
29 -
 30
30 -
 31
31 -
 32
32 -
 33
33 -
 34
34 -
 35
35 -
 36
36 -
 37
37 -
 38
38 -
 39
39 -
40
-
41
-
42
-
43
-
44
-
45
-
46
-
47
-
48
-
49
-
50
-
51
-
52
-
53
-
54
-
55
-
56
-
57
-
58
-
59
-
60
-
61
-
62
-
63
-
64
-
65
-
66
-
67
-
68
-
69
-
70
-
71
-
72
-
73
-
74
-
75
-
76
-
77
-
78
-
79
-
80
-
81
-
82
-
83
-
84
-
85
-
86
-
87
-
88
-
89
-
90
-
91
-
92
-
93
-
94
-
95
-
96
-
97
-
98
-
99
-
100
-
101
-
102
-
103
-
104
-
105
-
106
-
107
-
108
-
109
-
110
-
111
-
112
-
113
-
114
-
115
-
116
-
117
-
118
-
119
-
120
-
121
-
122
-
123
-
124
-
125
-
126
-
127
-
128
-
129
-
130
-
131
-
132
-
133
-
134
-
135
-
136
-
137
-
138
-
139
-
140
-
141
-
142
-
143
-
144
-
145
-
146
-
147
-
148
-
149
-
150
-
151
-
152
 |
 |

Table of Contents
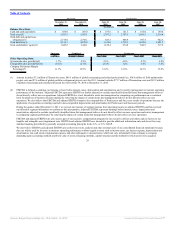
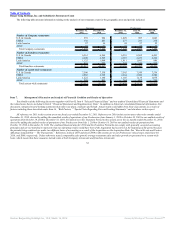
The selected consolidated financial and other operating data presented below contain all normal recurring adjustments that, in the opinion of management,
are necessary to present fairly our financial position and results of operations as of and for the periods presented. The selected historical consolidated financial
and other operating data included below and elsewhere in this report are not necessarily indicative of future results. The information presented below should be
read in conjunction with “Management’s Discussion and Analysis of Financial Condition and Results of Operations” in Part II, Item 7 and “Financial
Statements and Supplementary Data” in Part II, Item 8 of this report.
As of the Acquisition Date, all of our common shares were indirectly held by 3G; therefore we have not reported earnings per share.
Successor Combined Successor Predecessor
2011
Transition
Period
October 19, 2010
to
December 31, 2010
July 1, 2010
to
October 18, 2010
Fiscal
2010
Fiscal
2009
Fiscal
2008
Fiscal
2007
(In millions, except per share data)
Statement of Operations Data:
Revenues:
Company restaurant revenues $ 1,638.7 $ 846.2 $ 331.7 $ 514.5 $ 1,839.3 $ 1,880.5 $ 1,795.9 $ 1,658.0
Franchise and property
revenues 697.0 338.3 135.1 203.2 662.9 656.9 658.8 575.7
Total revenues 2,335.7 1,184.5 466.8 717.7 2,502.2 2,537.4 2,454.7 2,233.7
Income (loss) from operations(1) $ 363.0 $ 32.9 $ (68.6) $ 101.5 $ 332.9 $ 339.4 $ 354.2 $ 294.6
Net income (loss) $ 107.0 $ (30.5) $ (101.6) $ 71.1 $ 186.8 $ 200.1 $ 189.6 $ 148.1
Cash dividends per common
share N/A N/A N/A $ 0.06 $ 0.25 $ 0.25 $ 0.25 $ 0.13
Successor Combined Successor Predecessor
2011
Transition
Period
October 19, 2010 to
December 31, 2010
July 1, 2010 to
October 18, 2010
Fiscal
2010
Fiscal
2009
Fiscal
2008
Fiscal
2007
(In millions)
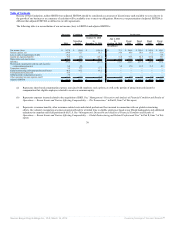
Other Financial Data:
Net cash provided by (used for)
operating activities $ 406.2 $ (5.2) $ (126.5) $ 121.3 $ 310.4 $ 310.8 $ 243.4 $ 110.4
Net cash used for investing
activities (41.4) (3,349.4) (3,344.6) (4.8) (134.9) (242.0) (199.3) (77.4)
Net cash provided by (used for)
financing activities (108.2) 3,366.9 3,396.4 (29.5) (96.9) (105.5) (62.0) (126.9)
Capital expenditures 82.1 46.6 28.4 18.2 150.3 204.0 178.2 87.3
Adjusted EBITDA(2) 585.0 230.1 95.2 134.9 460.9 455.6 460.6 387.3
28
Source: Burger King Holdings Inc, 10-K, March 14, 2012 Powered by Morningstar® Document Research℠