Burger King 2011 Annual Report Download - page 36
Download and view the complete annual report
Please find page 36 of the 2011 Burger King annual report below. You can navigate through the pages in the report by either clicking on the pages listed below, or by using the keyword search tool below to find specific information within the annual report.-
 1
1 -
2
-
3
-
4
-
5
-
6
-
7
-
8
-
9
-
10
-
11
-
12
-
13
-
14
-
15
-
16
-
17
-
18
-
19
-
20
-
21
-
22
-
23
-
24
-
25
-
 26
26 -
 27
27 -
 28
28 -
 29
29 -
 30
30 -
 31
31 -
 32
32 -
 33
33 -
 34
34 -
 35
35 -
 36
36 -
 37
37 -
 38
38 -
 39
39 -
 40
40 -
 41
41 -
 42
42 -
 43
43 -
 44
44 -
 45
45 -
 46
46 -
47
-
48
-
49
-
50
-
51
-
52
-
53
-
54
-
55
-
56
-
57
-
58
-
59
-
60
-
61
-
62
-
63
-
64
-
65
-
66
-
67
-
68
-
69
-
70
-
71
-
72
-
73
-
74
-
75
-
76
-
77
-
78
-
79
-
80
-
81
-
82
-
83
-
84
-
85
-
86
-
87
-
88
-
89
-
90
-
91
-
92
-
93
-
94
-
95
-
96
-
97
-
98
-
99
-
100
-
101
-
102
-
103
-
104
-
105
-
106
-
107
-
108
-
109
-
110
-
111
-
112
-
113
-
114
-
115
-
116
-
117
-
118
-
119
-
120
-
121
-
122
-
123
-
124
-
125
-
126
-
127
-
128
-
129
-
130
-
131
-
132
-
133
-
134
-
135
-
136
-
137
-
138
-
139
-
140
-
141
-
142
-
143
-
144
-
145
-
146
-
147
-
148
-
149
-
150
-
151
-
152
 |
 |

Table of Contents
addition, other involuntary work force reductions were also implemented. As a result of the global restructuring plan, VRS Program and the additional workforce
reductions, we incurred $46.5 million of severance benefits and other severance related costs in 2011. This restructuring plan was completed in 2011.
Field Optimization Project
During 2011, we initiated a project to significantly expand and enhance our U.S. field organization to better support our franchisees in an effort to drive
sales, increase profits and improve restaurant operations (the “field optimization project”). As a result of the field optimization project, we incurred $10.6 million
in 2011 of severance related costs, compensation costs for overlap staffing, travel expenses, consulting fees and training costs. This project was completed in
2011.
Global Portfolio Realignment Project
During 2011, we initiated a project to realign our global restaurant portfolio by refranchising our Company restaurants and establishing strategic partners
and joint ventures to accelerate development (the “global portfolio realignment project”). As a result of the global portfolio realignment project, we incurred
costs primarily related to severance and professional service fees and we expect to incur additional costs in 2012 as we continue to implement this strategy.
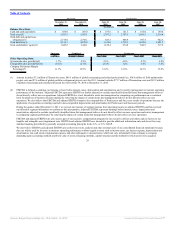
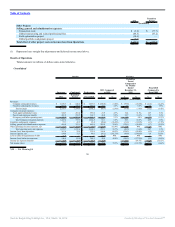
The table below summarizes the factors affecting comparability of results of operations due to acquisition accounting, the Transaction costs, global
restructuring and related professional fees, our field optimization project and the global portfolio realignment project.
2011
Transition
Period
(In millions)
Acquisition Accounting
Change in Revenues:
Lease straight-line adjustment $ (1.3) $ (0.1)
Amortization of direct financing leases (3.2) (0.2)
Amortization of favorable/unfavorable income leases 6.6 1.3
Total effect on franchise and property revenues 2.1 1.0
Change in food, paper & product costs:
Change in deferred income recognition (1.0) (0.2)
Total effect on food, paper & product costs (1.0) (0.2)
Change in occupancy and other operating costs:
Depreciation — Buildings, improvements, and equipment (11.2) (1.8)
Amortization of favorable/unfavorable leases (3.4) (0.6)
Total effect on occupancy and other operating costs (14.6) (2.4)
Change in selling, general and administrative expenses:
Depreciation — Software and furniture & fixtures 1.8 1.1
Total effect on selling, general and administrative expenses 1.8 1.1
Change in franchise and property expenses:
Lease straight-line adjustment (0.7) (0.1)
Depreciation of property leased or subleased to franchisees (5.1) (1.3)
Amortization of favorable/unfavorable leases (4.5) (0.9)
Amortization of franchise agreements (15.7) (3.1)
Total effect on franchise and property expenses (26.0) (5.4)
Total effect on income (loss) from operations $ (37.7) $ (5.9)
Total effect on Adjusted EBITDA(1) $ (3.0) $ (0.4)
35
Source: Burger King Holdings Inc, 10-K, March 14, 2012 Powered by Morningstar® Document Research℠