Burger King 2011 Annual Report Download - page 31
Download and view the complete annual report
Please find page 31 of the 2011 Burger King annual report below. You can navigate through the pages in the report by either clicking on the pages listed below, or by using the keyword search tool below to find specific information within the annual report.-
 1
1 -
2
-
3
-
4
-
5
-
6
-
7
-
8
-
9
-
10
-
11
-
12
-
13
-
14
-
15
-
16
-
17
-
18
-
19
-
20
-
 21
21 -
 22
22 -
 23
23 -
 24
24 -
 25
25 -
 26
26 -
 27
27 -
 28
28 -
 29
29 -
 30
30 -
 31
31 -
 32
32 -
 33
33 -
 34
34 -
 35
35 -
 36
36 -
 37
37 -
 38
38 -
 39
39 -
 40
40 -
 41
41 -
42
-
43
-
44
-
45
-
46
-
47
-
48
-
49
-
50
-
51
-
52
-
53
-
54
-
55
-
56
-
57
-
58
-
59
-
60
-
61
-
62
-
63
-
64
-
65
-
66
-
67
-
68
-
69
-
70
-
71
-
72
-
73
-
74
-
75
-
76
-
77
-
78
-
79
-
80
-
81
-
82
-
83
-
84
-
85
-
86
-
87
-
88
-
89
-
90
-
91
-
92
-
93
-
94
-
95
-
96
-
97
-
98
-
99
-
100
-
101
-
102
-
103
-
104
-
105
-
106
-
107
-
108
-
109
-
110
-
111
-
112
-
113
-
114
-
115
-
116
-
117
-
118
-
119
-
120
-
121
-
122
-
123
-
124
-
125
-
126
-
127
-
128
-
129
-
130
-
131
-
132
-
133
-
134
-
135
-
136
-
137
-
138
-
139
-
140
-
141
-
142
-
143
-
144
-
145
-
146
-
147
-
148
-
149
-
150
-
151
-
152
 |
 |

Table of Contents
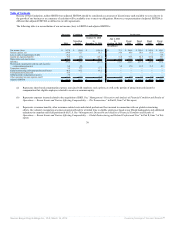
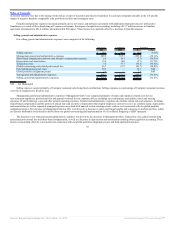
Because of their limitations, neither EBITDA nor adjusted EBITDA should be considered as a measure of discretionary cash available to us to reinvest in
the growth of our business or as a measure of cash that will be available to us to meet our obligations. Moreover, our presentation of adjusted EBITDA is
different than adjusted EBITDA as defined in our debt agreements.
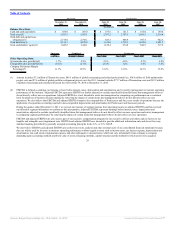
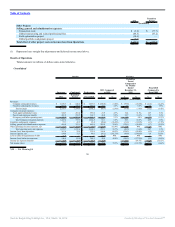
The following table is a reconciliation of our net income (loss) to EBITDA and adjusted EBITDA:
Successor Combined Successor Predecessor
2011
Transition
Period
October 19, 2010
to
December 31, 2010
July 1, 2010
to
October 18, 2010
Fiscal
2010
Fiscal
2009
Fiscal
2008
Fiscal
2007
(In millions)
Net income (loss) $ 107.0 $ (30.5) $ (101.6) $ 71.1 $ 186.8 $ 200.1 $ 189.6 $ 148.1
Interest expense, net 194.8 72.7 58.1 14.6 48.6 54.6 61.2 67.0
Loss on early extinguishment of debt 21.4 — — — — — — 0.8
Income tax expense (benefit) 39.8 (9.3) (25.1) 15.8 97.5 84.7 103.4 78.7
Depreciation and amortization 136.4 58.8 27.6 31.2 111.7 98.1 95.6 88.8
EBITDA 499.4 91.7 (41.0) 132.7 444.6 437.5 449.8 383.4
Share-based compensation and non-cash incentive
compensation expense(a) 6.4 5.8 — 5.8 17.0 16.2 11.4 4.9
Transaction costs(b) 3.2 77.7 77.7 — — — — —
Global restructuring and related professional fees(c) 46.5 67.2 67.2 — — — — —
Field optimization project(d) 10.6 — — — — — — —
Global portfolio realignment project(e) 7.6 — — — — — — —
Other operating (income) expense, net(f) 11.3 (12.3) (8.7) (3.6) (0.7) 1.9 (0.6) (1.0)
Adjusted EBITDA $ 585.0 $ 230.1 $ 95.2 $ 134.9 $ 460.9 $ 455.6 $ 460.6 $ 387.3
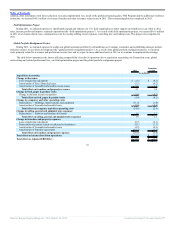
(a) Represents share-based compensation expense associated with employee stock options, as well as the portion of annual non-cash incentive
compensation that eligible employees elected to receive as common equity.
(b) Represents expenses incurred related to the acquisition of BKH. See “Management’s Discussion and Analysis of Financial Condition and Results of
Operations — Recent Events and Factors Affecting Comparability — The Transactions” in Part II, Item 7 of this report.
(c) Represents severance benefits, other severance-related costs and related professional fees incurred in connection with our global restructuring
efforts, the voluntary resignation severance program offered for a limited time to eligible employees based at our Miami headquarters and additional
reductions in corporate and field positions in the U.S. See “Management’s Discussion and Analysis of Financial Condition and Results of
Operations — Recent Events and Factors Affecting Comparability — Global Restructuring and Related Professional Fees” in Part II, Item 7 of this
report.
30
Source: Burger King Holdings Inc, 10-K, March 14, 2012 Powered by Morningstar® Document Research℠