Burger King 2011 Annual Report Download - page 61
Download and view the complete annual report
Please find page 61 of the 2011 Burger King annual report below. You can navigate through the pages in the report by either clicking on the pages listed below, or by using the keyword search tool below to find specific information within the annual report.-
 1
1 -
2
-
3
-
4
-
5
-
6
-
7
-
8
-
9
-
10
-
11
-
12
-
13
-
14
-
15
-
16
-
17
-
18
-
19
-
20
-
21
-
22
-
23
-
24
-
25
-
26
-
27
-
28
-
29
-
30
-
31
-
32
-
33
-
34
-
35
-
36
-
37
-
38
-
39
-
40
-
41
-
42
-
43
-
44
-
45
-
46
-
47
-
48
-
49
-
50
-
 51
51 -
 52
52 -
 53
53 -
 54
54 -
 55
55 -
 56
56 -
 57
57 -
 58
58 -
 59
59 -
 60
60 -
 61
61 -
 62
62 -
 63
63 -
 64
64 -
 65
65 -
 66
66 -
 67
67 -
 68
68 -
 69
69 -
 70
70 -
 71
71 -
72
-
73
-
74
-
75
-
76
-
77
-
78
-
79
-
80
-
81
-
82
-
83
-
84
-
85
-
86
-
87
-
88
-
89
-
90
-
91
-
92
-
93
-
94
-
95
-
96
-
97
-
98
-
99
-
100
-
101
-
102
-
103
-
104
-
105
-
106
-
107
-
108
-
109
-
110
-
111
-
112
-
113
-
114
-
115
-
116
-
117
-
118
-
119
-
120
-
121
-
122
-
123
-
124
-
125
-
126
-
127
-
128
-
129
-
130
-
131
-
132
-
133
-
134
-
135
-
136
-
137
-
138
-
139
-
140
-
141
-
142
-
143
-
144
-
145
-
146
-
147
-
148
-
149
-
150
-
151
-
152
 |
 |

Table of Contents
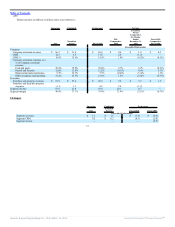
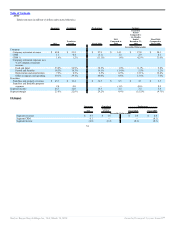
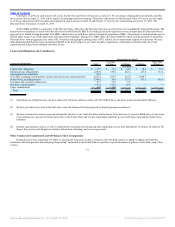
by franchisees on properties we own. Other capital expenditures include investments in information technology systems and corporate furniture and fixtures. The
following table presents capital expenditures, by type of expenditure:
Sucessor Predecessor
2011
October 19, 2010 to
December 31, 2010
July 1, 2010 to
October 18, 2010 Fiscal 2010 Fiscal 2009
(In millions)
New restaurants $ 6.8 $ 6.7 $ 1.8 $ 41.1 $ 65.4
Existing restaurants 65.7 16.7 11.1 91.7 110.1
Other, including corporate 9.6 5.0 5.3 17.5 28.5
Total $ 82.1 $ 28.4 $ 18.2 $ 150.3 $ 204.0
We expect cash capital expenditures of approximately $75.0 million to $85.0 million in 2012 to fund new restaurant development, maintenance capital
requirements, operational initiatives in our restaurants and other corporate expenditures. Our actual capital expenditures may be affected by economic and other
factors. We expect to fund capital expenditures from cash on hand, cash flow from operations and borrowings under the Revolving Credit Facility.
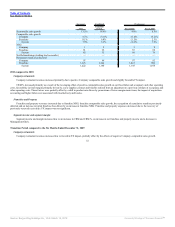
Financing Activities
Cash used by financing activities was $108.2 million in 2011, compared to $3,321.9 million during 2010, primarily as a result of the capital contribution
and borrowings associated with the Transactions in 2010 as further discussed below.
Cash provided by financing activities increased to $3,366.9 million during the Transition Period, compared to cash usage of $51.9 million during the same
period in the prior year. The increase in cash provided by financing activities was primarily a result of a capital contribution of $1,563.5 million associated with
the Transactions and the issuance of the Senior Notes and borrowings under the Term Loan Facility to fund the Transactions. These increases in cash were
partially offset by a $731.8 million principal repayment of Term Loans A and B under our prior credit facility as a result of the Transactions.
Cash used in financing activities decreased to $96.9 million in fiscal 2010, compared to $105.5 million in fiscal 2009, primarily as a result of a
$17.6 million decrease in cash used for repurchases of common stock, partially offset by a $10.3 million increase in net repayments of long-term debt and capital
leases, net of borrowings under our prior revolving credit facility.
Discount Notes
On April 8, 2011, Burger King Worldwide Holdings, Inc. (referred to as “Parent”), owned 99% by 3G, transferred all of its equity interests in BKH to
Burger King Capital Holdings, LLC, a Delaware limited liability company (referred to as “BKCH”), in exchange for membership interests in BKCH. As a result,
BKCH became a wholly-owned subsidiary of Parent and BKH became a wholly-owned subsidiary of BKCH.
On April 19, 2011, BKCH and Burger King Capital Finance, Inc., a Delaware corporation and another direct subsidiary of BKCH (“BK Finance” and,
together with BKCH, the “Issuers”) entered into an indenture with Wilmington Trust FSB, as trustee, pursuant to which the Issuers sold $685 million in
aggregate principal amount at maturity of 11.0% senior discount notes due 2019 (the “Discount Notes”). The Discount Notes generated $401.5 million in gross
proceeds. On October 19, 2011, the Board of Managers of BKCH approved a distribution to Parent and the Board of Directors of Parent approved a return of
capital distribution to the shareholders of Parent, including 3G, in the amount of $393.4 million, which was paid on December 16, 2011.
60
Source: Burger King Holdings Inc, 10-K, March 14, 2012 Powered by Morningstar® Document Research℠