Burger King 2011 Annual Report Download - page 75
Download and view the complete annual report
Please find page 75 of the 2011 Burger King annual report below. You can navigate through the pages in the report by either clicking on the pages listed below, or by using the keyword search tool below to find specific information within the annual report.-
 1
1 -
2
-
3
-
4
-
5
-
6
-
7
-
8
-
9
-
10
-
11
-
12
-
13
-
14
-
15
-
16
-
17
-
18
-
19
-
20
-
21
-
22
-
23
-
24
-
25
-
26
-
27
-
28
-
29
-
30
-
31
-
32
-
33
-
34
-
35
-
36
-
37
-
38
-
39
-
40
-
41
-
42
-
43
-
44
-
45
-
46
-
47
-
48
-
49
-
50
-
51
-
52
-
53
-
54
-
55
-
56
-
57
-
58
-
59
-
60
-
61
-
62
-
63
-
64
-
 65
65 -
 66
66 -
 67
67 -
 68
68 -
 69
69 -
 70
70 -
 71
71 -
 72
72 -
 73
73 -
 74
74 -
 75
75 -
 76
76 -
 77
77 -
 78
78 -
 79
79 -
 80
80 -
 81
81 -
 82
82 -
 83
83 -
 84
84 -
 85
85 -
86
-
87
-
88
-
89
-
90
-
91
-
92
-
93
-
94
-
95
-
96
-
97
-
98
-
99
-
100
-
101
-
102
-
103
-
104
-
105
-
106
-
107
-
108
-
109
-
110
-
111
-
112
-
113
-
114
-
115
-
116
-
117
-
118
-
119
-
120
-
121
-
122
-
123
-
124
-
125
-
126
-
127
-
128
-
129
-
130
-
131
-
132
-
133
-
134
-
135
-
136
-
137
-
138
-
139
-
140
-
141
-
142
-
143
-
144
-
145
-
146
-
147
-
148
-
149
-
150
-
151
-
152
 |
 |

Table of Contents
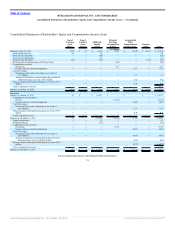
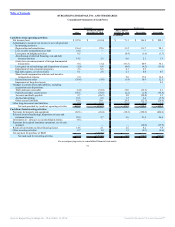
BURGER KING HOLDINGS, INC. AND SUBSIDIARIES
Consolidated Statements of Stockholders’ Equity and Comprehensive Income (Loss) — (Continued)
Consolidated Statements of Stockholders' Equity and Comprehensive Income (Loss)
Issued
Common
Stock
Shares
Issued
Common
Stock
Amount
Additional
Paid-In
Capital
Retained
Earnings
(Accumulated
Deficit)
Accumulated
Other
Comprehensive
Income (Loss)
Treasury
Stock Total
(In millions)
Balances at June 30, 2010 135.8 $ 1.4 $ 647.2 $ 608.0 $ (66.9) $ (61.3) $ 1,128.4
Stock option exercises 0.9 — 4.0 — — — 4.0
Stock option tax benefits — — (0.4) — — — (0.4)
Stock-based compensation — — 5.8 — — — 5.8
Treasury stock purchases (0.1) — (0.3) — — (2.2) (2.5)
Dividend paid on common shares ($0.25 per share) — — — (8.6) — — (8.6)
Comprehensive income:
Net income — — — 71.1 — — 71.1
Foreign currency translation adjustment — — — — 13.3 — 13.3
Cash flow hedges:
Net change in fair value of derivatives, net of tax of
$1.1 million — — — — 1.7 — 1.7
Amounts reclassified to earnings during the period from
terminated swaps, net of tax of $0.2 million — — — — (0.2) — (0.2)
Pension and post-retirement benefit plans, net of tax of $3.1
million — — — — 5.8 — 5.8
Total Comprehensive income 91.7
Balances at October 18, 2010 136.6 $ 1.4 $ 656.3 $ 670.5 $ (46.3) $ (63.5) $ 1,218.4
Successor
Balances at October 19, 2010 0.1 $ — $ 1,563.5 $ — $ — $ — $ 1,563.5
Comprehensive income (loss):
Net loss — — — (101.6) — — (101.6)
Foreign currency translation adjustment — — — — (48.5) — (48.5)
Cash flow hedges:
Net change in fair value of derivatives, net of tax of
$13.9 million — — — — 21.9 — 21.9
Pension and post-retirement benefit plans, net of tax of $3.9
million — — — — 8.8 — 8.8
Total Comprehensive loss — — — — — — (119.4)
Balances at December 31, 2010 0.1 — 1,563.5 (101.6) (17.8) — 1,444.1
Capital contributions — — 1.2 — — — 1.2
Dividend to Parent — — (7.6) — — — (7.6)
Comprehensive income (loss):
Net income — — — 107.0 — — 107.0
Foreign currency translation adjustment — — — (44.3) — (44.3)
Cash flow hedges:
Net change in fair value of derivatives, net of tax of
$26.4 million — — — — (40.9) — (40.9)
Amounts reclassified to earnings during the period from
terminated caps, net of tax of $0.4 million (0.6) (0.6)
Pension and post-retirement benefit plans, net of tax of $5.8
million — — — — (9.7) — (9.7)
Total Comprehensive income 5.1
Balances at December 31, 2011 0.1 $ — $ 1,557.1 $ 5.4 $ (113.3) $ — $ 1,449.2
See accompanying notes to consolidated financial statements.
74
Source: Burger King Holdings Inc, 10-K, March 14, 2012 Powered by Morningstar® Document Research℠