Burger King 2011 Annual Report Download - page 127
Download and view the complete annual report
Please find page 127 of the 2011 Burger King annual report below. You can navigate through the pages in the report by either clicking on the pages listed below, or by using the keyword search tool below to find specific information within the annual report.-
 1
1 -
2
-
3
-
4
-
5
-
6
-
7
-
8
-
9
-
10
-
11
-
12
-
13
-
14
-
15
-
16
-
17
-
18
-
19
-
20
-
21
-
22
-
23
-
24
-
25
-
26
-
27
-
28
-
29
-
30
-
31
-
32
-
33
-
34
-
35
-
36
-
37
-
38
-
39
-
40
-
41
-
42
-
43
-
44
-
45
-
46
-
47
-
48
-
49
-
50
-
51
-
52
-
53
-
54
-
55
-
56
-
57
-
58
-
59
-
60
-
61
-
62
-
63
-
64
-
65
-
66
-
67
-
68
-
69
-
70
-
71
-
72
-
73
-
74
-
75
-
76
-
77
-
78
-
79
-
80
-
81
-
82
-
83
-
84
-
85
-
86
-
87
-
88
-
89
-
90
-
91
-
92
-
93
-
94
-
95
-
96
-
97
-
98
-
99
-
100
-
101
-
102
-
103
-
104
-
105
-
106
-
107
-
108
-
109
-
110
-
111
-
112
-
113
-
114
-
115
-
116
-
 117
117 -
 118
118 -
 119
119 -
 120
120 -
 121
121 -
 122
122 -
 123
123 -
 124
124 -
 125
125 -
 126
126 -
 127
127 -
 128
128 -
 129
129 -
 130
130 -
 131
131 -
 132
132 -
 133
133 -
 134
134 -
 135
135 -
 136
136 -
 137
137 -
138
-
139
-
140
-
141
-
142
-
143
-
144
-
145
-
146
-
147
-
148
-
149
-
150
-
151
-
152
 |
 |
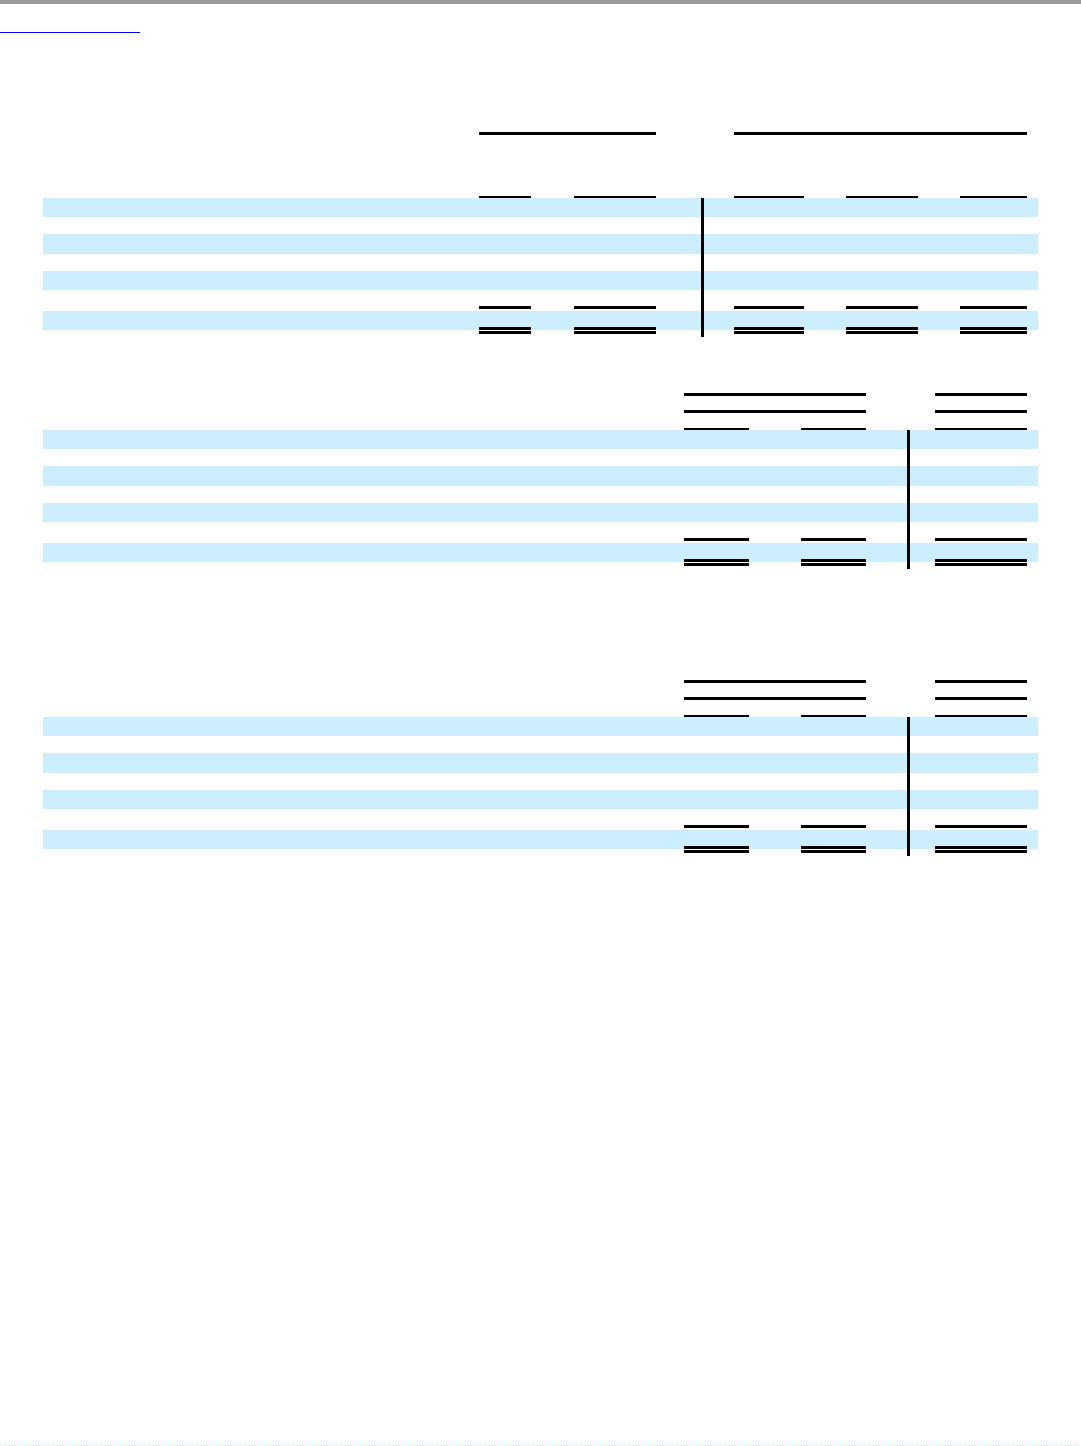
Table of Contents
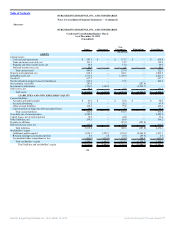
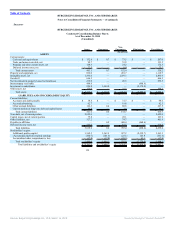
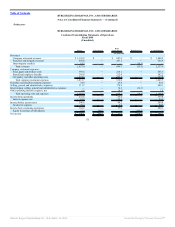
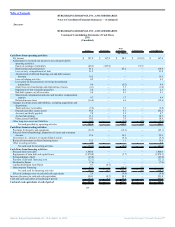
BURGER KING HOLDINGS, INC. AND SUBSIDIARIES
Notes to Consolidated Financial Statements — (Continued)
Successor Predecessor
2011
October 19,
2010 to
December 31,
2010
July 1,
2010 to
October 18,
2010 Fiscal 2010 Fiscal 2009
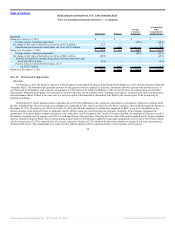
Depreciation and Amortization:
United States and Canada $ 86.2 $ 16.8 $ 20.2 $ 72.8 $ 63.4
EMEA 22.6 4.4 3.5 14.8 13.7
LAC 6.7 1.8 1.5 4.9 5.6
APAC 7.6 2.3 1.5 3.2 2.0
Unallocated 13.3 2.3 4.5 16.0 13.4
Total depreciation and amortization $ 136.4 $ 27.6 $ 31.2 $ 111.7 $ 98.1
Successor Predecessor
As of December 31, As of June 30,
2011 2010 2010
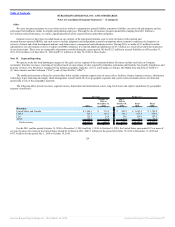
Assets:
United States and Canada $ 4,787.5 $ 4,904.4 $ 2,047.6
EMEA 568.9 542.8 482.8
LAC 53.4 64.0 66.8
APAC 141.0 129.8 109.7
Unallocated 32.7 42.1 40.3
Total assets $ 5,583.5 $ 5,683.1 $ 2,747.2
The goodwill reflected in our consolidated balance sheet is $657.7 million as of December 31, 2011. We assigned $254.8 million of goodwill to U.S. and
Canada, $198.8 million to EMEA, $137.9 million to LAC and $66.2 million to APAC.
Successor Predecessor
As of December 31, As of June 30,
2011 2010 2010
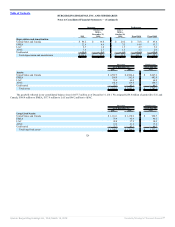
Long-Lived Assets:
United States and Canada $ 1,114.1 $ 1,170.9 $ 960.7
EMEA 73.9 93.9 96.2
LAC 28.8 37.9 38.0
APAC 19.2 21.4 17.4
Unallocated 32.7 42.1 40.3
Total long-lived assets $ 1,268.7 $ 1,366.2 $ 1,152.6
126
Source: Burger King Holdings Inc, 10-K, March 14, 2012 Powered by Morningstar® Document Research℠