Burger King 2011 Annual Report Download - page 38
Download and view the complete annual report
Please find page 38 of the 2011 Burger King annual report below. You can navigate through the pages in the report by either clicking on the pages listed below, or by using the keyword search tool below to find specific information within the annual report.-
 1
1 -
2
-
3
-
4
-
5
-
6
-
7
-
8
-
9
-
10
-
11
-
12
-
13
-
14
-
15
-
16
-
17
-
18
-
19
-
20
-
21
-
22
-
23
-
24
-
25
-
26
-
27
-
 28
28 -
 29
29 -
 30
30 -
 31
31 -
 32
32 -
 33
33 -
 34
34 -
 35
35 -
 36
36 -
 37
37 -
 38
38 -
 39
39 -
 40
40 -
 41
41 -
 42
42 -
 43
43 -
 44
44 -
 45
45 -
 46
46 -
 47
47 -
 48
48 -
49
-
50
-
51
-
52
-
53
-
54
-
55
-
56
-
57
-
58
-
59
-
60
-
61
-
62
-
63
-
64
-
65
-
66
-
67
-
68
-
69
-
70
-
71
-
72
-
73
-
74
-
75
-
76
-
77
-
78
-
79
-
80
-
81
-
82
-
83
-
84
-
85
-
86
-
87
-
88
-
89
-
90
-
91
-
92
-
93
-
94
-
95
-
96
-
97
-
98
-
99
-
100
-
101
-
102
-
103
-
104
-
105
-
106
-
107
-
108
-
109
-
110
-
111
-
112
-
113
-
114
-
115
-
116
-
117
-
118
-
119
-
120
-
121
-
122
-
123
-
124
-
125
-
126
-
127
-
128
-
129
-
130
-
131
-
132
-
133
-
134
-
135
-
136
-
137
-
138
-
139
-
140
-
141
-
142
-
143
-
144
-
145
-
146
-
147
-
148
-
149
-
150
-
151
-
152
 |
 |

Table of Contents
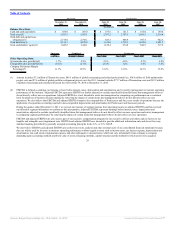
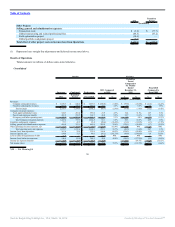
FX Impact
Successor Combined Predecessor
2011
Transition
Period Fiscal 2010 Fiscal 2009
Favorable/(Unfavorable)
Consolidated revenues $ 35.6 $ (17.3) $ 17.4 $ (95.8)
Consolidated CRM 2.6 (1.3) 1.2 (8.0)
Consolidated SG&A (8.2) 6.7 (2.8) 15.2
Consolidated income (loss) from operations 5.3 (1.9) (0.3) (3.5)
Consolidated net income (loss) 5.7 (3.0) (2.2) (1.8)
Consolidated adjusted EBITDA 4.5 (2.5) 1.4 (5.7)
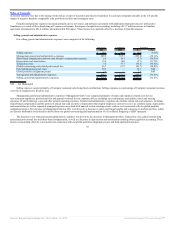
Key Business Metrics
2011
Transition
Period
Fiscal
2010
Fiscal
2009
Systemwide sales growth 1.7% 2.2% 2.1% 4.2%
Comparable sales growth
Company 0.1% (3.8)% (2.4)% 0.3%
Franchise (0.6)% (2.5)% (2.3)% 1.4%
System (0.5)% (2.7)% (2.3)% 1.2%
Average restaurant sales (in thousands) $ 1,248.0 $ 622.0 $ 1,244.0 $ 1,259.0
NRG
Company (4) 4 10 33
Franchise 265 169 239 327
System 261 173 249 360
Net Refranchisings (trailing twelve months) 45 82 52 (36)
Restaurant counts at period end
Company 1,295 1,344 1,387 1,429
Franchise 11,217 10,907 10,787 10,496
System 12,512 12,251 12,174 11,925
CRM % 11.7% 12.9% 12.2% 12.6%
2011 compared to 2010
Company restaurants
Company restaurant revenues decreased due to the net refranchising of 45 Company restaurants, primarily in the U.S. and Canada, partially offset by
favorable FX impact across all segments.
CRM % decreased due to the effects of acquisition accounting, higher commodity prices in the U.S. and Canada and EMEA and a non-recurring $4.7
million favorable adjustment to our self insurance reserve in 2010. These factors were partially offset by improved labor margins due to benefits realized from
improvements in variable labor controls and scheduling in our restaurants as well as changes in U.S. restaurant compensation plans to more closely align
incentive compensation with restaurant performance.
Franchise and Property
Franchise and property revenues consist primarily of royalties earned on franchise sales, franchise fees and rents from real estate leased or subleased to
franchisees. Franchise and property revenues increased primarily due to new leases and subleases associated with the refranchised restaurants, royalties derived
from franchise NRG, favorable FX impact and the impact of acquisition accounting. These factors were partially offset by a decrease
37
Source: Burger King Holdings Inc, 10-K, March 14, 2012 Powered by Morningstar® Document Research℠