Burger King 2011 Annual Report Download - page 78
Download and view the complete annual report
Please find page 78 of the 2011 Burger King annual report below. You can navigate through the pages in the report by either clicking on the pages listed below, or by using the keyword search tool below to find specific information within the annual report.-
 1
1 -
2
-
3
-
4
-
5
-
6
-
7
-
8
-
9
-
10
-
11
-
12
-
13
-
14
-
15
-
16
-
17
-
18
-
19
-
20
-
21
-
22
-
23
-
24
-
25
-
26
-
27
-
28
-
29
-
30
-
31
-
32
-
33
-
34
-
35
-
36
-
37
-
38
-
39
-
40
-
41
-
42
-
43
-
44
-
45
-
46
-
47
-
48
-
49
-
50
-
51
-
52
-
53
-
54
-
55
-
56
-
57
-
58
-
59
-
60
-
61
-
62
-
63
-
64
-
65
-
66
-
67
-
 68
68 -
 69
69 -
 70
70 -
 71
71 -
 72
72 -
 73
73 -
 74
74 -
 75
75 -
 76
76 -
 77
77 -
 78
78 -
 79
79 -
 80
80 -
 81
81 -
 82
82 -
 83
83 -
 84
84 -
 85
85 -
 86
86 -
 87
87 -
 88
88 -
89
-
90
-
91
-
92
-
93
-
94
-
95
-
96
-
97
-
98
-
99
-
100
-
101
-
102
-
103
-
104
-
105
-
106
-
107
-
108
-
109
-
110
-
111
-
112
-
113
-
114
-
115
-
116
-
117
-
118
-
119
-
120
-
121
-
122
-
123
-
124
-
125
-
126
-
127
-
128
-
129
-
130
-
131
-
132
-
133
-
134
-
135
-
136
-
137
-
138
-
139
-
140
-
141
-
142
-
143
-
144
-
145
-
146
-
147
-
148
-
149
-
150
-
151
-
152
 |
 |

Table of Contents
BURGER KING HOLDINGS, INC. AND SUBSIDIARIES
Notes to Consolidated Financial Statements
Note 1. Description of Business and Organization
Description of Business
Burger King Holdings, Inc. is a Delaware corporation formed on July 23, 2002. We are the parent of Burger King Corporation (also referred to as “BKC”),
a Florida corporation that franchises and operates fast food hamburger restaurants, principally under the Burger King brand (also referred to as the “Brand”). We
are the world’s second largest fast food hamburger restaurant, or FFHR, chain as measured by the total number of restaurants. For convenience, the terms
“Burger King Holdings”, “BKH”, “Company”, and “we” are used to refer collectively to Burger King Holdings, Inc. and its subsidiaries, unless the context
otherwise requires.
We generate revenues from two sources: (i) retail sales at company-owned restaurants (also referred to as “Company restaurants”) and (ii) franchise and
property revenues, consisting primarily of royalties based on a percentage of sales reported by franchise restaurants, initial and renewal franchise fees paid by
franchisees and property income from restaurants that we lease or sublease to franchisees.
Restaurant sales are affected by the timing and effectiveness of our advertising, new products and promotional programs. Our results of operations also
fluctuate from quarter to quarter as a result of seasonal trends and other factors, such as the timing of restaurant openings and closings and the acquisition of
franchise restaurants, as well as variability of the weather. Restaurant sales are typically higher in the spring and summer months when the weather is warmer
than in the fall and winter months. Restaurant sales during the winter are typically highest in December, during the holiday shopping season. Our restaurant sales
and Company restaurant margin are typically lowest during the winter months, which include February, the shortest month of the year. The timing of religious
holidays may also impact restaurant sales.
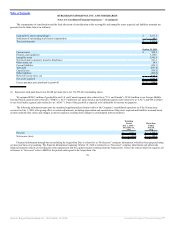
The Transactions
On October 19, 2010 (referred to as the “Acquisition Date”), 3G Capital Partners Ltd., an investment firm based in New York City (referred to as “3G
Capital”, or “Sponsor”), completed its acquisition of 100% of Burger King Holdings’ equity (referred to as the “Acquisition”) through 3G Special Situations
Fund II, LLP (“3G”), an investment vehicle controlled by the Sponsor.
The Acquisition was accounted for as a business combination using the acquisition method of accounting. In addition, accounting rules required us to
apply push down accounting as a result of the change in ownership in BKH. As a result, our post-Acquisition financial statements reflect a new basis of
accounting.
The Acquisition and related financing transactions (collectively referred to as the “Transactions”) required total cash of approximately $4.3 billion,
including transaction costs. The Transactions were financed with $1.56 billion in equity contributed by 3G, proceeds from the issuance of new term loans
consisting of a $1.51 billion tranche denominated in U.S. dollars and a €250 million tranche denominated in Euros, the net proceeds from the issuance of
$800 million of Senior Notes and $69.4 million of cash on hand. (See Note 8.)
In 2010, fees and expenses related to the Transactions totaled $91.2 million, including (1) $43.2 million consisting principally of investment banking fees
and legal fees (which are classified as selling, general and administrative expenses), (2) compensation related expenses of $34.5 million (which are classified as
selling, general and administrative expenses) and (3) commitment fees of $13.5 million associated with the bridge loan available at the closing of the
Transactions (which are classified as interest expense during the period of October 19, 2010 to December 31, 2010). Debt issuance costs capitalized in
connection with the issuance of debt to fund the Transactions totaled $69.2 million and are classified as Other Assets.
77
Source: Burger King Holdings Inc, 10-K, March 14, 2012 Powered by Morningstar® Document Research℠