Burger King 2011 Annual Report Download - page 76
Download and view the complete annual report
Please find page 76 of the 2011 Burger King annual report below. You can navigate through the pages in the report by either clicking on the pages listed below, or by using the keyword search tool below to find specific information within the annual report.-
 1
1 -
2
-
3
-
4
-
5
-
6
-
7
-
8
-
9
-
10
-
11
-
12
-
13
-
14
-
15
-
16
-
17
-
18
-
19
-
20
-
21
-
22
-
23
-
24
-
25
-
26
-
27
-
28
-
29
-
30
-
31
-
32
-
33
-
34
-
35
-
36
-
37
-
38
-
39
-
40
-
41
-
42
-
43
-
44
-
45
-
46
-
47
-
48
-
49
-
50
-
51
-
52
-
53
-
54
-
55
-
56
-
57
-
58
-
59
-
60
-
61
-
62
-
63
-
64
-
65
-
 66
66 -
 67
67 -
 68
68 -
 69
69 -
 70
70 -
 71
71 -
 72
72 -
 73
73 -
 74
74 -
 75
75 -
 76
76 -
 77
77 -
 78
78 -
 79
79 -
 80
80 -
 81
81 -
 82
82 -
 83
83 -
 84
84 -
 85
85 -
 86
86 -
87
-
88
-
89
-
90
-
91
-
92
-
93
-
94
-
95
-
96
-
97
-
98
-
99
-
100
-
101
-
102
-
103
-
104
-
105
-
106
-
107
-
108
-
109
-
110
-
111
-
112
-
113
-
114
-
115
-
116
-
117
-
118
-
119
-
120
-
121
-
122
-
123
-
124
-
125
-
126
-
127
-
128
-
129
-
130
-
131
-
132
-
133
-
134
-
135
-
136
-
137
-
138
-
139
-
140
-
141
-
142
-
143
-
144
-
145
-
146
-
147
-
148
-
149
-
150
-
151
-
152
 |
 |

Table of Contents
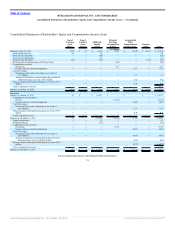
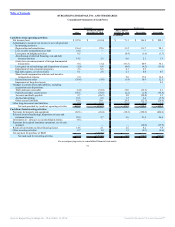
BURGER KING HOLDINGS, INC. AND SUBSIDIARIES
Consolidated Statements of Cash Flows
Successor Predecessor
2011
October 19, 2010 to
December 31, 2010
July 1, 2010 to
October 18, 2010 Fiscal 2010 Fiscal 2009
(In millions)
Cash flows from operating activities:
Net income (loss) $ 107.0 $ (101.6) $ 71.1 $ 186.8 $ 200.1
Adjustments to reconcile net income to net cash provided
by operating activities:
Depreciation and amortization 136.4 27.6 31.2 111.7 98.1
Loss on early extinguishment of debt 21.4 — — — —
Loss (gain) on hedging activities 0.5 — (0.4) (1.6) (1.3)
Amortization of deferred financing cost and debt
issuance discount 14.5 2.6 0.6 2.1 1.9
(Gain) loss on remeasurement of foreign denominated
transactions 0.4 (3.2) (41.5) 40.9 50.1
Loss (gain) on refranchisings and dispositions of assets (1.0) 0.8 (4.6) (9.5) (11.0)
Impairment of non-restaurant properties 2.3 0.6 0.1 2.9 —
Bad debt expense, net of recoveries 6.1 2.8 2.1 0.8 0.7
Share-based compensation and non-cash incentive
compensation expense 6.4 — 5.8 17.0 16.2
Deferred income taxes (30.4) (9.8) (1.4) 16.9 12.1
Impairment of long-lived assets — — — — 0.5
Changes in current assets and liabilities, excluding
acquisitions and dispositions:
Trade and notes receivable (6.0) (32.5) 32.0 (15.9) 2.1
Prepaids and other current assets 105.5 (70.6) (2.2) (1.4) (35.4)
Accounts and drafts payable 8.7 (26.5) 9.0 (20.8) 3.3
Accrued advertising 18.3 6.8 1.3 6.4 (7.7)
Other accrued liabilities 18.4 58.1 29.4 (22.3) (20.8)
Other long-term assets and liabilities (2.3) 18.4 (11.2) (3.6) 1.9
Net cash provided by (used for) operating activities 406.2 (126.5) 121.3 310.4 310.8
Cash flows from investing activities:
Payments for property and equipment (82.1) (28.4) (18.2) (150.3) (204.0)
Proceeds from refranchisings, disposition of asset and
restaurant closures 29.9 5.7 9.6 21.5 26.4
Investments in / advances to unconsolidated entities (4.5) — — — —
Payments for acquired franchisee operations, net of cash
acquired — — — (14.0) (67.9)
Return of investment on direct financing leases 14.6 2.1 2.6 8.2 7.9
Other investing activities 0.7 1.4 1.2 (0.3) (4.4)
Net payment for purchase of BKH — (3,325.4) — — —
Net cash used for investing activities (41.4) (3,344.6) (4.8) (134.9) (242.0)
See accompanying notes to consolidated financial statements.
75
Source: Burger King Holdings Inc, 10-K, March 14, 2012 Powered by Morningstar® Document Research℠