Burger King 2011 Annual Report Download - page 120
Download and view the complete annual report
Please find page 120 of the 2011 Burger King annual report below. You can navigate through the pages in the report by either clicking on the pages listed below, or by using the keyword search tool below to find specific information within the annual report.-
 1
1 -
2
-
3
-
4
-
5
-
6
-
7
-
8
-
9
-
10
-
11
-
12
-
13
-
14
-
15
-
16
-
17
-
18
-
19
-
20
-
21
-
22
-
23
-
24
-
25
-
26
-
27
-
28
-
29
-
30
-
31
-
32
-
33
-
34
-
35
-
36
-
37
-
38
-
39
-
40
-
41
-
42
-
43
-
44
-
45
-
46
-
47
-
48
-
49
-
50
-
51
-
52
-
53
-
54
-
55
-
56
-
57
-
58
-
59
-
60
-
61
-
62
-
63
-
64
-
65
-
66
-
67
-
68
-
69
-
70
-
71
-
72
-
73
-
74
-
75
-
76
-
77
-
78
-
79
-
80
-
81
-
82
-
83
-
84
-
85
-
86
-
87
-
88
-
89
-
90
-
91
-
92
-
93
-
94
-
95
-
96
-
97
-
98
-
99
-
100
-
101
-
102
-
103
-
104
-
105
-
106
-
107
-
108
-
109
-
 110
110 -
 111
111 -
 112
112 -
 113
113 -
 114
114 -
 115
115 -
 116
116 -
 117
117 -
 118
118 -
 119
119 -
 120
120 -
 121
121 -
 122
122 -
 123
123 -
 124
124 -
 125
125 -
 126
126 -
 127
127 -
 128
128 -
 129
129 -
 130
130 -
131
-
132
-
133
-
134
-
135
-
136
-
137
-
138
-
139
-
140
-
141
-
142
-
143
-
144
-
145
-
146
-
147
-
148
-
149
-
150
-
151
-
152
 |
 |

Table of Contents
BURGER KING HOLDINGS, INC. AND SUBSIDIARIES
Notes to Consolidated Financial Statements — (Continued)
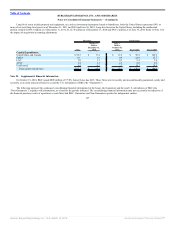
The Company recorded $1.2 million of share-based compensation expense, as well as $5.2 million of annual non-cash incentive compensation that eligible
employees elected to receive as common equity in selling, general and administrative expenses for 2011. No stock options were exercised during 2011.
Cancellations during 2011 were not significant. As of December 31, 2011, there was $6.1 million of total unrecognized compensation cost related to stock
options, which is expected to be recognized over a weighted average period of 3.8 years.
As a result of the Acquisition (see Note 1 — Transactions), the Predecessor’s unvested share-based compensation awards were accelerated to vest and,
together with previously vested awards, were cancelled and settled in cash using the $24.00 purchase price per share of common stock paid by 3G in the
Acquisition. Compensation expense resulting from the accelerated vesting of plan awards related to non-vested awards at the Acquisition Date totaling
$30.4 million is included in selling, general and administrative expenses in our consolidated statements of operations for the period of October 19, 2010 to
December 31, 2010.
Predecessor
The Predecessor recorded $5.8 million of stock-based compensation expense from July 1, 2010 through October 18, 2010, $17.0 million in Fiscal 2010
and $16.2 million in Fiscal 2009, in selling, general and administrative expenses.
Equity Incentive Plan and 2006 Omnibus Incentive Plan
Prior to the Acquisition, stock-based compensation expense for stock options was estimated on the grant date using a Black-Scholes option pricing model.
The Predecessor’s specific weighted-average assumptions for the risk- free interest rate, expected term, expected volatility and expected dividend yield are
discussed below. Additionally, the Predecessor was required to estimate pre-vesting forfeitures for purposes of determining compensation expense to be
recognized. Future expense amounts for any quarterly or annual period could have been affected by changes in the Predecessor’s assumptions or changes in
market conditions.
The Predecessor determined the expected term of stock options granted using the simplified method. Based on the results of applying the simplified
method, the Predecessor determined that 6.25 years was an appropriate expected term for awards with four-year graded vesting.
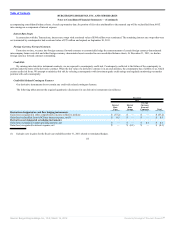
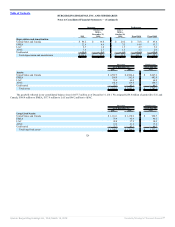
The fair value of each stock option granted under the Plans during July 1, 2010 through October 18, 2010 and for Fiscal 2010 and 2009 was estimated on
the date of grant using the Black-Scholes option pricing model based on the following weighted-average assumptions:
Predecessor
July 1,
2010 to
October 18,
2010 Fiscal 2010 Fiscal 2009
Risk-free interest rate 1.83% 2.92% 3.33%
Expected term (in years) 6.25 6.25 6.25
Expected volatility 38.34% 37.15% 31.80%
Expected dividend yield 1.43% 1.37% 0.96%
The weighted average grant date fair value of stock options granted was $6.02 during the period July 1, 2010 through October 18, 2010, $6.56 for Fiscal
2010 and $8.54 for Fiscal 2009. The total intrinsic value of stock options exercised was $3.2 million during the period July 1, 2010 through October 18, 2010,
$8.1 million
119
Source: Burger King Holdings Inc, 10-K, March 14, 2012 Powered by Morningstar® Document Research℠