Burger King 2011 Annual Report Download - page 125
Download and view the complete annual report
Please find page 125 of the 2011 Burger King annual report below. You can navigate through the pages in the report by either clicking on the pages listed below, or by using the keyword search tool below to find specific information within the annual report.-
 1
1 -
2
-
3
-
4
-
5
-
6
-
7
-
8
-
9
-
10
-
11
-
12
-
13
-
14
-
15
-
16
-
17
-
18
-
19
-
20
-
21
-
22
-
23
-
24
-
25
-
26
-
27
-
28
-
29
-
30
-
31
-
32
-
33
-
34
-
35
-
36
-
37
-
38
-
39
-
40
-
41
-
42
-
43
-
44
-
45
-
46
-
47
-
48
-
49
-
50
-
51
-
52
-
53
-
54
-
55
-
56
-
57
-
58
-
59
-
60
-
61
-
62
-
63
-
64
-
65
-
66
-
67
-
68
-
69
-
70
-
71
-
72
-
73
-
74
-
75
-
76
-
77
-
78
-
79
-
80
-
81
-
82
-
83
-
84
-
85
-
86
-
87
-
88
-
89
-
90
-
91
-
92
-
93
-
94
-
95
-
96
-
97
-
98
-
99
-
100
-
101
-
102
-
103
-
104
-
105
-
106
-
107
-
108
-
109
-
110
-
111
-
112
-
113
-
114
-
 115
115 -
 116
116 -
 117
117 -
 118
118 -
 119
119 -
 120
120 -
 121
121 -
 122
122 -
 123
123 -
 124
124 -
 125
125 -
 126
126 -
 127
127 -
 128
128 -
 129
129 -
 130
130 -
 131
131 -
 132
132 -
 133
133 -
 134
134 -
 135
135 -
136
-
137
-
138
-
139
-
140
-
141
-
142
-
143
-
144
-
145
-
146
-
147
-
148
-
149
-
150
-
151
-
152
 |
 |

Table of Contents
BURGER KING HOLDINGS, INC. AND SUBSIDIARIES
Notes to Consolidated Financial Statements — (Continued)
Other
We carry insurance programs to cover claims such as workers’ compensation, general liability, automotive liability, executive risk and property, and are
self-insured for healthcare claims for eligible participating employees. Through the use of insurance program deductibles (ranging from $0.1 million to
$2.5 million) and self insurance, we retain a significant portion of the expected losses under these programs.
Insurance reserves have been recorded based on our estimate of the anticipated ultimate costs to settle all claims, both reported and
incurred-but-not-reported (IBNR), and such reserves include judgments and independent actuarial assumptions about economic conditions, the frequency or
severity of claims and claim development patterns, and claim reserve, management and settlement practices. During 2010, we made a $1.5 million favorable
adjustment to our self insurance reserve to adjust our IBNR confidence level and an additional adjustment of $3.3 million as a result of favorable developments
in our claim trends. There were no comparable adjustments recorded during the current period. We had $32.3 million in accrued liabilities as of December 31,
2011, $34.4 million as of December 31, 2010 and $37.1 million as of June 30, 2010 for these claims.
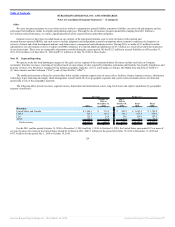
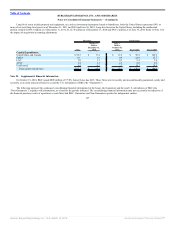
Note 19. Segment Reporting
We operate in the fast food hamburger category of the quick service segment of the restaurant industry. Revenues include retail sales at Company
restaurants, franchise revenues, consisting of royalties based on a percentage of sales reported by franchise restaurants and franchise fees paid by franchisees, and
property revenues. Our business is managed in four distinct geographic segments: (1) U.S. and Canada; (2) Europe, the Middle East and Africa (“EMEA”);
(3) Latin America and the Caribbean (“LAC”); and (4) Asia Pacific (“APAC”).
The unallocated amounts reflected in certain tables below include corporate support costs in areas such as facilities, finance, human resources, information
technology, legal, marketing and supply chain management, which benefit all of our geographic segments and system-wide restaurants and are not allocated
specifically to any of the geographic segments.
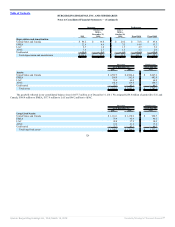
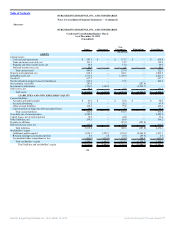
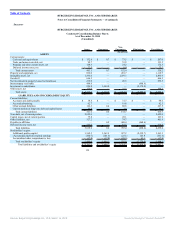
The following tables present revenues, segment income, depreciation and amortization, assets, long-lived assets and capital expenditures by geographic
segment (in millions):
Successor Predecessor
2011
October 19,
2010 to
December 31,
2010
July 1,
2010 to
October 18,
2010
Fiscal
2010
Fiscal
2009
Revenues:
United States and Canada $ 1,569.1 $ 315.5 $ 483.2 $ 1,695.2 $ 1,743.0
EMEA 525.6 104.7 169.1 635.4 650.6
LAC 128.1 24.8 34.0 109.0 107.0
APAC 112.9 21.8 31.4 62.6 36.8
Total revenues $ 2,335.7 $ 466.8 $ 717.7 $ 2,502.2 $ 2,537.4
For the 2011 and the periods October 19, 2010 to December 31, 2010 and July 1, 2010 to October 18, 2010, the United States represented 10% or more of
our total revenues. Revenues in the United States totaled $1.4 billion in 2011, $283.7 million for the period of October 19, 2010 to December 31, 2010 and
$437.4 million for the period July 1, 2010 to October 18, 2010.
124
Source: Burger King Holdings Inc, 10-K, March 14, 2012 Powered by Morningstar® Document Research℠