Burger King 2011 Annual Report Download - page 79
Download and view the complete annual report
Please find page 79 of the 2011 Burger King annual report below. You can navigate through the pages in the report by either clicking on the pages listed below, or by using the keyword search tool below to find specific information within the annual report.-
 1
1 -
2
-
3
-
4
-
5
-
6
-
7
-
8
-
9
-
10
-
11
-
12
-
13
-
14
-
15
-
16
-
17
-
18
-
19
-
20
-
21
-
22
-
23
-
24
-
25
-
26
-
27
-
28
-
29
-
30
-
31
-
32
-
33
-
34
-
35
-
36
-
37
-
38
-
39
-
40
-
41
-
42
-
43
-
44
-
45
-
46
-
47
-
48
-
49
-
50
-
51
-
52
-
53
-
54
-
55
-
56
-
57
-
58
-
59
-
60
-
61
-
62
-
63
-
64
-
65
-
66
-
67
-
68
-
 69
69 -
 70
70 -
 71
71 -
 72
72 -
 73
73 -
 74
74 -
 75
75 -
 76
76 -
 77
77 -
 78
78 -
 79
79 -
 80
80 -
 81
81 -
 82
82 -
 83
83 -
 84
84 -
 85
85 -
 86
86 -
 87
87 -
 88
88 -
 89
89 -
90
-
91
-
92
-
93
-
94
-
95
-
96
-
97
-
98
-
99
-
100
-
101
-
102
-
103
-
104
-
105
-
106
-
107
-
108
-
109
-
110
-
111
-
112
-
113
-
114
-
115
-
116
-
117
-
118
-
119
-
120
-
121
-
122
-
123
-
124
-
125
-
126
-
127
-
128
-
129
-
130
-
131
-
132
-
133
-
134
-
135
-
136
-
137
-
138
-
139
-
140
-
141
-
142
-
143
-
144
-
145
-
146
-
147
-
148
-
149
-
150
-
151
-
152
 |
 |

Table of Contents
BURGER KING HOLDINGS, INC. AND SUBSIDIARIES
Notes to Consolidated Financial Statements — (Continued)
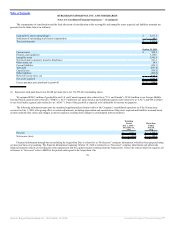
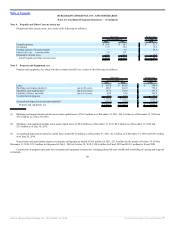
The computations of consideration and the final allocation of consideration to the net tangible and intangible assets acquired and liabilities assumed are
presented in the tables below (in millions):
Cash paid for shares outstanding(1) $ 3,277.3
Settlement of outstanding stock-based compensation 48.1
Total consideration $ 3,325.4
October 19, 2010
Current assets $ 508.2
Property and equipment 1,118.0
Intangible assets 2,945.8
Net investment in property leased to franchisees 261.6
Other assets, net 58.6
Current liabilities (454.1)
Term debt (667.4)
Capital leases (106.8)
Other liabilities (402.6)
Deferred income taxes, net (616.7)
Net assets acquired $ 2,644.6
Excess purchase price attributed to goodwill $ 680.8
(1) Represents cash paid, based on a $24.00 per share price, for 136,555,642 outstanding shares.
We assigned $260.3 million of goodwill to our U.S. and Canada segment (also referred to as “U.S. and Canada”), $216.4 million to our Europe, Middle
East and Africa segment (also referred to “EMEA”), $137.9 million to our Latin America and Caribbean segment (also referred to as “LAC”) and $66.2 million
to our Asia Pacific segment (also referred to as “APAC”). None of the goodwill is expected to be deductible for income tax purposes.
The following information represents the unaudited supplemental pro forma results of the Company’s consolidated operations as if the Transactions
occurred on July 1, 2009, after giving effect to certain adjustments, including depreciation and amortization of the assets acquired and liabilities assumed based
on their estimated fair values and changes in interest expenses resulting from changes in consolidated debt (in millions):
Transition
Period
July 1, 2010 —
December 31,
2010
Fiscal Year
Ended
June 30,
2010
Revenue $ 1,185.2 $ 2,505.8
Net income (loss) $ (41.0) $ 128.2
Financial information through but not including the Acquisition Date is referred to as “Predecessor” company information, which has been prepared using
our previous basis of accounting. The financial information beginning October 19, 2010 is referred to as “Successor” company information and reflects the
financial statement effects of recording fair value adjustments and the capital structure resulting from the Transactions. Unless the context otherwise requires, all
references to “Successor” refer to BKH for the periods subsequent to the Acquisition. Our
78
Source: Burger King Holdings Inc, 10-K, March 14, 2012 Powered by Morningstar® Document Research℠