Burger King 2011 Annual Report Download - page 92
Download and view the complete annual report
Please find page 92 of the 2011 Burger King annual report below. You can navigate through the pages in the report by either clicking on the pages listed below, or by using the keyword search tool below to find specific information within the annual report.-
 1
1 -
2
-
3
-
4
-
5
-
6
-
7
-
8
-
9
-
10
-
11
-
12
-
13
-
14
-
15
-
16
-
17
-
18
-
19
-
20
-
21
-
22
-
23
-
24
-
25
-
26
-
27
-
28
-
29
-
30
-
31
-
32
-
33
-
34
-
35
-
36
-
37
-
38
-
39
-
40
-
41
-
42
-
43
-
44
-
45
-
46
-
47
-
48
-
49
-
50
-
51
-
52
-
53
-
54
-
55
-
56
-
57
-
58
-
59
-
60
-
61
-
62
-
63
-
64
-
65
-
66
-
67
-
68
-
69
-
70
-
71
-
72
-
73
-
74
-
75
-
76
-
77
-
78
-
79
-
80
-
81
-
 82
82 -
 83
83 -
 84
84 -
 85
85 -
 86
86 -
 87
87 -
 88
88 -
 89
89 -
 90
90 -
 91
91 -
 92
92 -
 93
93 -
 94
94 -
 95
95 -
 96
96 -
 97
97 -
 98
98 -
 99
99 -
 100
100 -
 101
101 -
 102
102 -
103
-
104
-
105
-
106
-
107
-
108
-
109
-
110
-
111
-
112
-
113
-
114
-
115
-
116
-
117
-
118
-
119
-
120
-
121
-
122
-
123
-
124
-
125
-
126
-
127
-
128
-
129
-
130
-
131
-
132
-
133
-
134
-
135
-
136
-
137
-
138
-
139
-
140
-
141
-
142
-
143
-
144
-
145
-
146
-
147
-
148
-
149
-
150
-
151
-
152
 |
 |
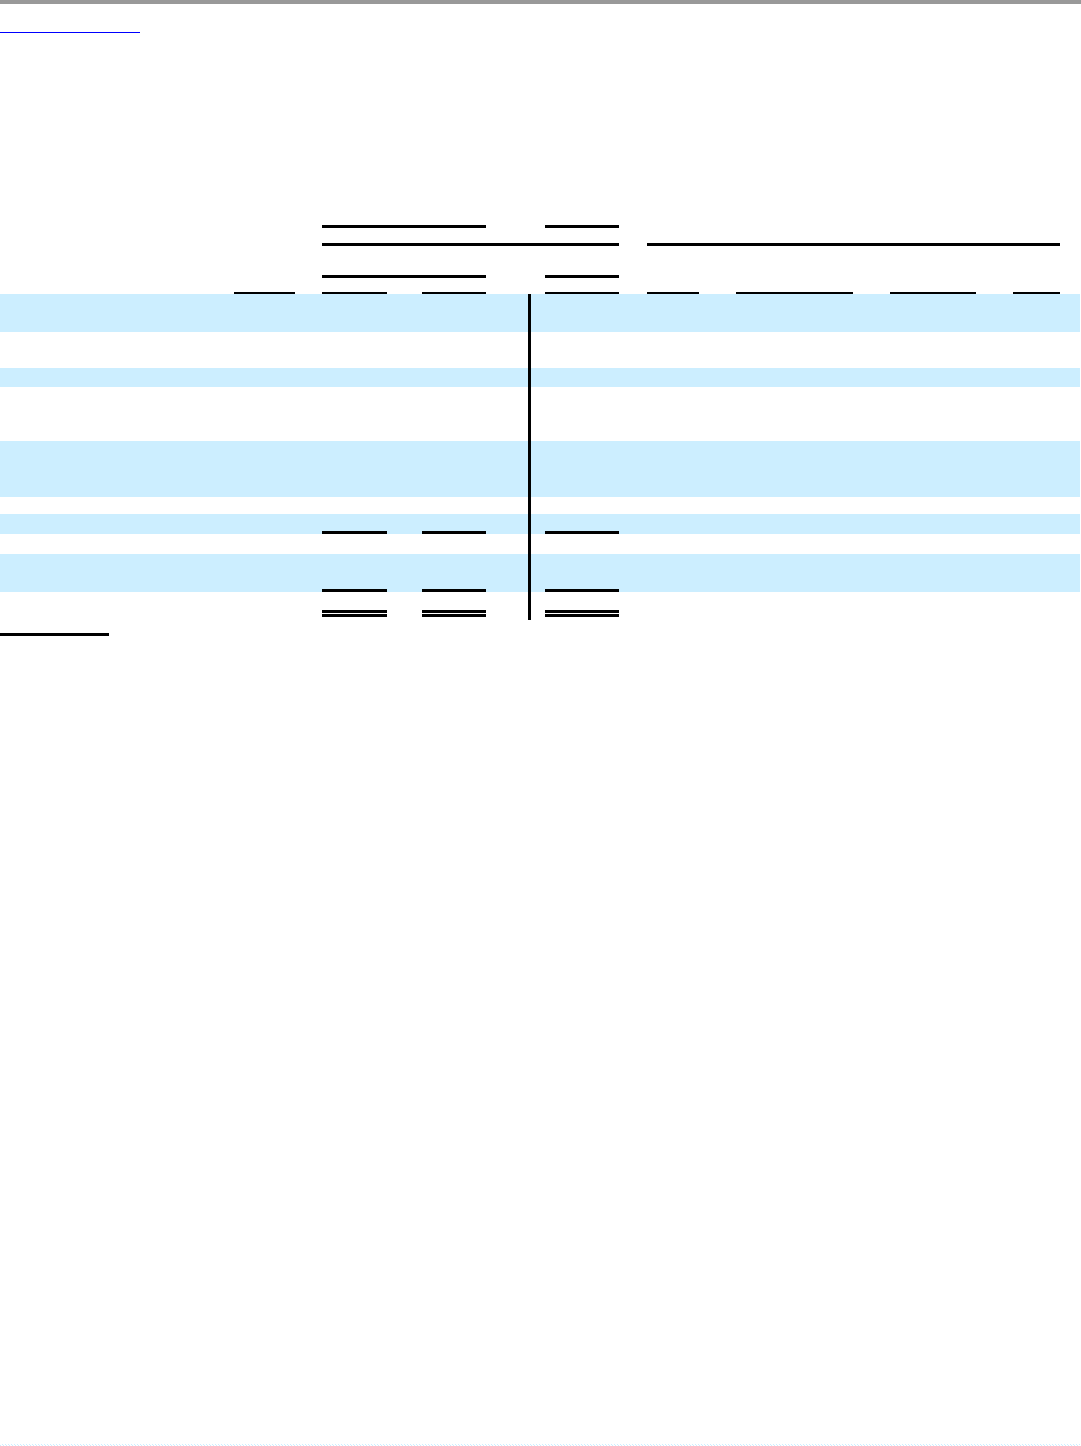
Table of Contents
BURGER KING HOLDINGS, INC. AND SUBSIDIARIES
Notes to Consolidated Financial Statements — (Continued)
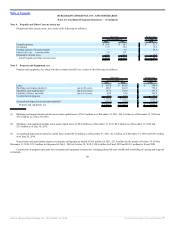
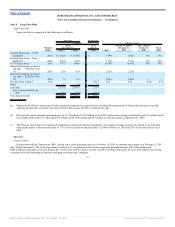
Note 8. Long-Term Debt
Long-Term Debt
Long-term debt is comprised of the following (in millions):
Successor Predecessor
Principal Interest rates(a)
Maturity
dates
As of
December 31,
As of
June 30,
October 19, 2010 to
December 31,
2010
July 1, 2010 to
October 18,
2010
Fiscal
2010
2011 2010 2010 2011
Secured Term Loan — USD
tranche(b) 2016 $ 1,532.0 $ 1,510.0 $ — 5.49% 6.82% N/A N/A
Secured Term Loan — Euro
tranche(b) 2016 247.8 334.2 5.79% 7.11% N/A N/A
9 7/8% Senior Notes 2018 797.5 800.0 — 10.14% 10.19% N/A N/A
Deferred Premiums on interest
rate caps — USD (See Note
13) 2016 35.8 42.4 — 2.52% 2.52% — —
Deferred Premiums on interest
rate caps — EUR (See Note
13) 2016 7.3 11.1 — 2.86% 2.86% — —
Previous Term Loans(c) N/A — — 753.7 N/A N/A 4.4% 4.7%
Other 3.2 1.4 1.7
Total debt 2,623.6 2,699.1 755.4
Less: current maturities of
debt (24.2) (27.0) (87.7)
Total long-term debt $ 2,599.4 $ 2,672.1 $ 667.7
(a) Represents the effective interest rate for the instrument computed on a quarterly basis, including the amortization of deferred debt issuance costs and
original issue discount, and in the case of our Secured Term Loans, the effect of interest rate caps.
(b) Principal face amount herein is presented gross of a 1% discount of $12.5 million on the USD tranche and revolving credit facility and $1.0 million on the
Euro tranche at December 31, 2011 and $16.8 million on the USD tranche and $3.3 million on the Euro tranche at December 31, 2010.
(c) The Previous Term Loans were repaid and terminated in connection with the Transactions. The weighted average interest rates related to our term debt
included the impact of interest rate swaps on 77% of our term debt for the period July 1, 2010 to October 18, 2010 and 73% of our term debt in Fiscal
2010.
Successor
Credit Facilities
In connection with the Transactions, BKC entered into a credit agreement dated as of October 19, 2010, as amended and restated as of February 15, 2011
(the “Credit Agreement”). The Credit Agreement provides for (i) two tranches of term loans in aggregate principal amounts of $1,600.0 million and
€200.0 million, each under a term loan facility (the “Term Loan Facility”) and (ii) a senior secured revolving credit facility for up to $150 million of revolving
extensions of credit outstanding at any time (including revolving loans, swingline
91
Source: Burger King Holdings Inc, 10-K, March 14, 2012 Powered by Morningstar® Document Research℠