Burger King 2011 Annual Report Download - page 47
Download and view the complete annual report
Please find page 47 of the 2011 Burger King annual report below. You can navigate through the pages in the report by either clicking on the pages listed below, or by using the keyword search tool below to find specific information within the annual report.-
 1
1 -
2
-
3
-
4
-
5
-
6
-
7
-
8
-
9
-
10
-
11
-
12
-
13
-
14
-
15
-
16
-
17
-
18
-
19
-
20
-
21
-
22
-
23
-
24
-
25
-
26
-
27
-
28
-
29
-
30
-
31
-
32
-
33
-
34
-
35
-
36
-
 37
37 -
 38
38 -
 39
39 -
 40
40 -
 41
41 -
 42
42 -
 43
43 -
 44
44 -
 45
45 -
 46
46 -
 47
47 -
 48
48 -
 49
49 -
 50
50 -
 51
51 -
 52
52 -
 53
53 -
 54
54 -
 55
55 -
 56
56 -
 57
57 -
58
-
59
-
60
-
61
-
62
-
63
-
64
-
65
-
66
-
67
-
68
-
69
-
70
-
71
-
72
-
73
-
74
-
75
-
76
-
77
-
78
-
79
-
80
-
81
-
82
-
83
-
84
-
85
-
86
-
87
-
88
-
89
-
90
-
91
-
92
-
93
-
94
-
95
-
96
-
97
-
98
-
99
-
100
-
101
-
102
-
103
-
104
-
105
-
106
-
107
-
108
-
109
-
110
-
111
-
112
-
113
-
114
-
115
-
116
-
117
-
118
-
119
-
120
-
121
-
122
-
123
-
124
-
125
-
126
-
127
-
128
-
129
-
130
-
131
-
132
-
133
-
134
-
135
-
136
-
137
-
138
-
139
-
140
-
141
-
142
-
143
-
144
-
145
-
146
-
147
-
148
-
149
-
150
-
151
-
152
 |
 |

Table of Contents
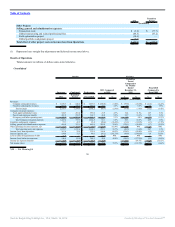
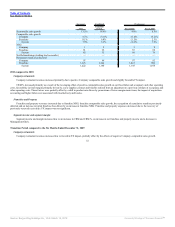
Key Business Metrics
Successor Combined Predecessor
2011
Transition
Period Fiscal 2010 Fiscal 2009
Systemwide sales growth (3.3)% (4.4)% (3.1)% 1.2%
Comparable sales growth
Company (1.9)% (4.9)% (2.4)% 0.5%
Franchise (3.6)% (5.0)% (4.1)% 0.4%
System (3.4)% (5.0)% (3.9)% 0.4%
NRG
Company (7) (1) (5) 17
Franchise (43) 6 20 5
System (50) 5 15 22
Net Refranchisings (trailing twelve months) 38 44 51 (73)
Restaurant counts at period end
Company 939 984 987 1,043
Franchise 6,561 6,566 6,562 6,491
System 7,500 7,550 7,549 7,534
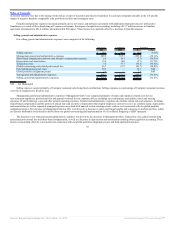
2011 compared to 2010
Company restaurants
Company restaurant revenues decreased primarily due to the net refranchising of 38 Company restaurants and the effects of negative Company comparable
sales growth. These factors were partially offset by favorable FX impact in Canada.
CRM% decreased primarily due to the impact of sales deleverage on our fixed occupancy and other operating costs, the impact of acquisition accounting,
other operating costs to implement new initiatives at our Company restaurants and lower food margins driven by higher commodity prices in the U.S. In addition,
CRM% decreased due to a non-recurring $4.7 million favorable adjustment to the self insurance reserve in the U.S. and Canada in 2010. These factors were
partially offset by changes in restaurant compensation plans to more closely align incentive compensation with restaurant performance, benefits realized from
improvements in variable labor controls and scheduling in our restaurants and benefits derived from strategic pricing initiatives.
Franchise and Property
Franchise and property revenues decreased due to the impact of negative franchise comparable sales growth on royalties and contingent rents and a
decrease in renewal franchise fees due to the timing of renewals as a result of incentives provided to franchisees to accelerate restaurant remodels. These factors
were partially offset by favorable FX impact in Canada and the impact of acquisition accounting adjustments.
Franchise and property expenses increased primarily due to additional restaurants leased or subleased to franchisees as a result of the net refranchising of
Company restaurants, the impact of acquisition accounting, including a $5.2 million increase in franchise agreement amortization to $11.0 million and an
increase in bad debt expense.
Segment income and segment margin
Segment income and margin increased due to a decrease in Management G&A partially offset by a decrease in Company restaurant margin and net
franchise and property income.
46
Source: Burger King Holdings Inc, 10-K, March 14, 2012 Powered by Morningstar® Document Research℠