Burger King 2011 Annual Report Download - page 37
Download and view the complete annual report
Please find page 37 of the 2011 Burger King annual report below. You can navigate through the pages in the report by either clicking on the pages listed below, or by using the keyword search tool below to find specific information within the annual report.-
 1
1 -
2
-
3
-
4
-
5
-
6
-
7
-
8
-
9
-
10
-
11
-
12
-
13
-
14
-
15
-
16
-
17
-
18
-
19
-
20
-
21
-
22
-
23
-
24
-
25
-
26
-
 27
27 -
 28
28 -
 29
29 -
 30
30 -
 31
31 -
 32
32 -
 33
33 -
 34
34 -
 35
35 -
 36
36 -
 37
37 -
 38
38 -
 39
39 -
 40
40 -
 41
41 -
 42
42 -
 43
43 -
 44
44 -
 45
45 -
 46
46 -
 47
47 -
48
-
49
-
50
-
51
-
52
-
53
-
54
-
55
-
56
-
57
-
58
-
59
-
60
-
61
-
62
-
63
-
64
-
65
-
66
-
67
-
68
-
69
-
70
-
71
-
72
-
73
-
74
-
75
-
76
-
77
-
78
-
79
-
80
-
81
-
82
-
83
-
84
-
85
-
86
-
87
-
88
-
89
-
90
-
91
-
92
-
93
-
94
-
95
-
96
-
97
-
98
-
99
-
100
-
101
-
102
-
103
-
104
-
105
-
106
-
107
-
108
-
109
-
110
-
111
-
112
-
113
-
114
-
115
-
116
-
117
-
118
-
119
-
120
-
121
-
122
-
123
-
124
-
125
-
126
-
127
-
128
-
129
-
130
-
131
-
132
-
133
-
134
-
135
-
136
-
137
-
138
-
139
-
140
-
141
-
142
-
143
-
144
-
145
-
146
-
147
-
148
-
149
-
150
-
151
-
152
 |
 |

Table of Contents
2011
Transition
Period
(In millions)
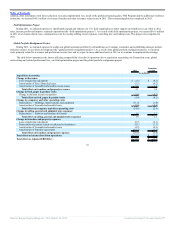
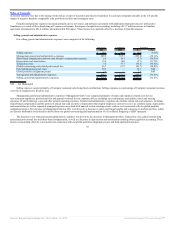
Other Projects
Selling, general and administrative expenses:
Transaction costs $ (3.2) $ (77.7)
Global restructuring and related professional fees (46.5) (67.2)
Field optimization project (10.6) —
Global portfolio realignment project (7.6) —
Total effect of other project costs on income (loss) from Operations $ (67.9) $ (144.9)
(1) Represents lease straight-line adjustments and deferred income noted above.
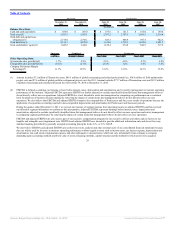
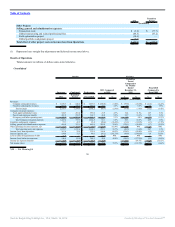
Results of Operations
Tabular amounts in millions of dollars unless noted otherwise.
Consolidated
Results Variance
Successor Combined Predecessor
2011 Compared
to 2010
Transition
Period
Compared to
Six Months
Ended
December 31,
2009
Fiscal 2010
Compared to
Fiscal 2009
2011
Transition
Period Fiscal 2010 $ % $ % $ %
Favorable / (Unfavorable)
Revenues:
Company restaurant revenues $ 1,638.7 $ 846.2 $ 1,839.3 $ (100.8) (5.8)% $ (99.8) (10.5)% $ (41.2) (2.2)%
Franchise and property revenues 697.0 338.3 662.9 32.1 4.8% 2.0 0.6% 6.0 0.9%
Total revenues 2,335.7 1,184.5 2,502.2 (68.7) (2.9)% (97.8) (7.6)% (35.2) (1.4)%
Company restaurant expenses:
Food, paper and product costs 524.7 265.4 585.0 25.9 4.7% 34.4 11.5% 18.7 3.1%
Payroll and employee benefits 481.2 252.5 568.7 48.8 9.2% 38.7 13.3% 13.5 2.3%
Occupancy and other operating costs 441.5 219.4 461.1 10.4 2.3% 9.2 4.0% (3.3) (0.7)%
Total Company restaurant expenses 1,447.4 737.3 1,614.8 85.1 5.6% 82.3 10.0% 28.9 1.8%
Franchise and property expenses 97.1 43.5 65.4 (20.6) (26.9)% (11.1) (34.3)% (1.1) (1.7)%
Selling, general and administrative expenses 416.9 383.1 489.8 202.0 32.6% (129.1) (50.8)% (1.7) (0.3)%
Other operating (income) expenses, net 11.3 (12.3) (0.7) (29.4) 162.4% 17.4 NM 2.6 NM
Total operating costs and expenses 1,972.7 1,151.6 2,169.3 237.1 10.7% (40.5) (3.6)% 28.7 1.3%
Income (loss) from operations 363.0 32.9 332.9 168.4 86.5% (138.3) (80.8)% (6.5) (1.9)%
Interest expense, net 194.8 72.7 48.6 (98.2) (101.7)% (48.0) (194.3)% 6.0 11.0%
Loss on early extinguishment of debt 21.4 — — (21.4) NM — NM — NM
Income (loss) before income taxes 146.8 (39.8) 284.3 48.8 49.8% (186.3) (127.2)% (0.5) (0.2)%
Income tax expense (benefit) 39.8 (9.3) 97.5 (1.4) 59.0 118.7% (12.8) (15.1)%
Net income (loss) $ 107.0 $ (30.5) $ 186.8 $ 47.4 79.5% $ (127.3) (131.5)% $ (13.3) (6.6)%
NM — Not Meaningful
36
Source: Burger King Holdings Inc, 10-K, March 14, 2012 Powered by Morningstar® Document Research℠