Burger King 2011 Annual Report Download - page 35
Download and view the complete annual report
Please find page 35 of the 2011 Burger King annual report below. You can navigate through the pages in the report by either clicking on the pages listed below, or by using the keyword search tool below to find specific information within the annual report.-
 1
1 -
2
-
3
-
4
-
5
-
6
-
7
-
8
-
9
-
10
-
11
-
12
-
13
-
14
-
15
-
16
-
17
-
18
-
19
-
20
-
21
-
22
-
23
-
24
-
 25
25 -
 26
26 -
 27
27 -
 28
28 -
 29
29 -
 30
30 -
 31
31 -
 32
32 -
 33
33 -
 34
34 -
 35
35 -
 36
36 -
 37
37 -
 38
38 -
 39
39 -
 40
40 -
 41
41 -
 42
42 -
 43
43 -
 44
44 -
 45
45 -
46
-
47
-
48
-
49
-
50
-
51
-
52
-
53
-
54
-
55
-
56
-
57
-
58
-
59
-
60
-
61
-
62
-
63
-
64
-
65
-
66
-
67
-
68
-
69
-
70
-
71
-
72
-
73
-
74
-
75
-
76
-
77
-
78
-
79
-
80
-
81
-
82
-
83
-
84
-
85
-
86
-
87
-
88
-
89
-
90
-
91
-
92
-
93
-
94
-
95
-
96
-
97
-
98
-
99
-
100
-
101
-
102
-
103
-
104
-
105
-
106
-
107
-
108
-
109
-
110
-
111
-
112
-
113
-
114
-
115
-
116
-
117
-
118
-
119
-
120
-
121
-
122
-
123
-
124
-
125
-
126
-
127
-
128
-
129
-
130
-
131
-
132
-
133
-
134
-
135
-
136
-
137
-
138
-
139
-
140
-
141
-
142
-
143
-
144
-
145
-
146
-
147
-
148
-
149
-
150
-
151
-
152
 |
 |

Table of Contents
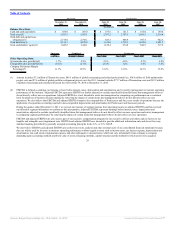
restaurant expenses are comprised of food, paper and product costs, payroll and employee benefits (“labor” costs) and occupancy and other
operating costs, which include rent and depreciation and amortization related to restaurant properties (“occupancy and other operating” costs). Food,
paper and product costs vary with sales volume, while labor and occupancy costs are primarily fixed costs with variable components. We review the
relationship between our Company restaurant expenses and Company restaurant revenues in the context of how those relationships affect CRM and
CRM %.
• Adjusted EBITDA represents earnings before interest, taxes, depreciation and amortization adjusted to exclude specifically identified items that
management believes do not directly reflect our core operations. These items include share-based compensation and non-cash compensation
expense, other operating (income) expenses, net, and all other specifically identified costs associated with non-recurring projects; Transaction costs,
global restructuring and related professional fees, field optimization project costs and global portfolio realignment project costs. See Profitability
Measures and Non-GAAP Reconciliations.
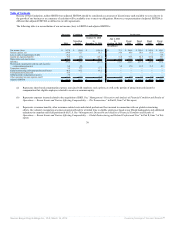
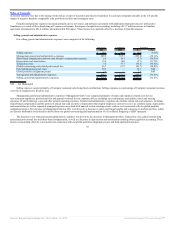
Comparable sales and sales growth are measured on a constant currency basis, which means the results exclude the effect of foreign currency translation
and are calculated by translating current year results at prior year exchange rates. We analyze certain key financial measures on a constant currency basis as this
helps identify underlying business trends, without distortion from the effects of currency movements (“FX impact”).
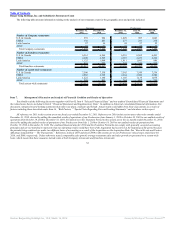
Recent Events and Factors Affecting Comparability
The Transactions
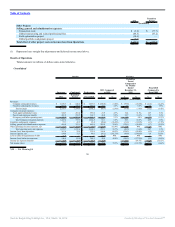
The Acquisition and related financing transactions (collectively referred to as the “Transactions”) as described in Note 1 to the accompanying consolidated
financial statements were accounted for using the acquisition method of accounting, or acquisition accounting, in accordance with Financial Accounting Standard
Board (“FASB”) Accounting Standard Codification (“ASC”) Topic 805, Business Combinations. During the quarter ended December 31, 2011, we finalized our
purchase price allocation on a retrospective basis as of the Acquisition Date, with corresponding adjustments to our results of operations. Acquisition accounting
resulted in certain items that affect the comparability of the results of operations between us and our Predecessor, including changes in asset carrying values (and
related depreciation and amortization).
Additionally, our interest expense is significantly higher following the Transactions than experienced by our Predecessor in prior periods, primarily due to
the higher principal amount of debt outstanding following the Transactions, as well as higher interest rates.
Change in Fiscal Year
On November 5, 2010, our Board of Directors approved a change in fiscal year end from June 30 to December 31. The change became effective at the end
of the quarter ended December 31, 2010. All references to “fiscal”, unless otherwise noted, refer to the twelve-month fiscal year, which prior to July 1, 2010,
ended on June 30.
Change in Presentation
Franchise bad debt expense and amortization of franchise agreements previously classified as selling, general and administrative expenses have been
reclassified to franchise and property expenses for all periods presented. These reclassifications have no effect on previously reported net income (loss).
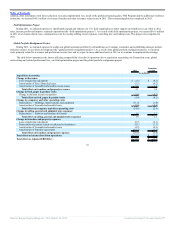
Global Restructuring and Related Professional Fees
In December 2010, we began the implementation of a global restructuring plan that resulted in work force reductions throughout our organization. In
June 2011, we implemented a Voluntary Resignation Severance Program (“VRS Program”) offered for a limited time to eligible employees based at our Miami
headquarters. In
34
Source: Burger King Holdings Inc, 10-K, March 14, 2012 Powered by Morningstar® Document Research℠