Burger King 2011 Annual Report Download - page 49
Download and view the complete annual report
Please find page 49 of the 2011 Burger King annual report below. You can navigate through the pages in the report by either clicking on the pages listed below, or by using the keyword search tool below to find specific information within the annual report.-
 1
1 -
2
-
3
-
4
-
5
-
6
-
7
-
8
-
9
-
10
-
11
-
12
-
13
-
14
-
15
-
16
-
17
-
18
-
19
-
20
-
21
-
22
-
23
-
24
-
25
-
26
-
27
-
28
-
29
-
30
-
31
-
32
-
33
-
34
-
35
-
36
-
37
-
38
-
 39
39 -
 40
40 -
 41
41 -
 42
42 -
 43
43 -
 44
44 -
 45
45 -
 46
46 -
 47
47 -
 48
48 -
 49
49 -
 50
50 -
 51
51 -
 52
52 -
 53
53 -
 54
54 -
 55
55 -
 56
56 -
 57
57 -
 58
58 -
 59
59 -
60
-
61
-
62
-
63
-
64
-
65
-
66
-
67
-
68
-
69
-
70
-
71
-
72
-
73
-
74
-
75
-
76
-
77
-
78
-
79
-
80
-
81
-
82
-
83
-
84
-
85
-
86
-
87
-
88
-
89
-
90
-
91
-
92
-
93
-
94
-
95
-
96
-
97
-
98
-
99
-
100
-
101
-
102
-
103
-
104
-
105
-
106
-
107
-
108
-
109
-
110
-
111
-
112
-
113
-
114
-
115
-
116
-
117
-
118
-
119
-
120
-
121
-
122
-
123
-
124
-
125
-
126
-
127
-
128
-
129
-
130
-
131
-
132
-
133
-
134
-
135
-
136
-
137
-
138
-
139
-
140
-
141
-
142
-
143
-
144
-
145
-
146
-
147
-
148
-
149
-
150
-
151
-
152
 |
 |

Table of Contents
Franchise and property expenses increased due to the net effect of changes to our property portfolio as a result of the net refranchising of Company
restaurants and positive franchise NRG.
Segment income and segment margin
Segment income and margin increased due to an increase in CRM partially offset by a decrease in net franchise and property income and increases in
Management G&A.
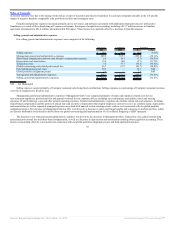
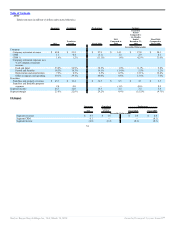
EMEA
Tabular amounts in millions of dollars unless noted otherwise.
Successor Combined Predecessor Variance
2011
Transition
Period Fiscal 2010
2011
Compared to
2010
Transition
Period
Compared to
Six Months
Ended
December 31,
2009
Fiscal 2010
Compared to
Fiscal 2009
Favorable/(Unfavorable)
Company:
Company restaurant revenues $ 330.7 $ 181.9 $ 461.3 $ (59.9) $ (70.6) $ (19.7)
CRM 35.5 21.5 45.3 (1.1) (8.7) (12.8)
CRM % 10.7% 11.8% 9.8% 1.4% (0.1)% (2.3)%
Company restaurant expenses as a %
of Company restaurant revenue:
Food and paper 29.4% 28.4% 28.4% (1.1)% 0.2% 0.1%
Payroll and benefits 31.4% 32.1% 33.6% 2.1% 0.6% (0.7)%
Depreciation and amortization 3.5% 3.0% 2.8% (0.3)% (0.6)% (0.4)%
Other occupancy and operating 25.0% 24.7% 25.4% 0.7% (0.3)% (1.3)%
Franchise:
Franchise and property revenues $ 194.9 $ 91.9 $ 174.1 $ 20.2 $ 0.7 $ 4.5
Franchise and franchise property
expenses 25.9 13.5 23.0 (1.7) (1.2) 3.0
Segment income 146.0 50.9 85.3 58.5 2.6 0.6
Segment margin 27.8% 18.6% 13.4% 12.3% 4.5% 0.4%
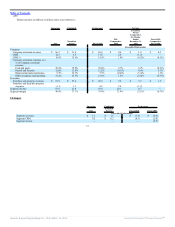
FX Impact
Successor Combined Predecessor
2011
Transition
Period Fiscal 2010 Fiscal 2009
Favorable/(Unfavorable)
Segment revenues $ 23.4 $ (23.8) $ 5.1 $ (64.8)
Segment CRM 1.7 (1.8) 0.4 (4.7)
Segment income 6.4 (2.5) 0.8 (3.9)
48
Source: Burger King Holdings Inc, 10-K, March 14, 2012 Powered by Morningstar® Document Research℠