Burger King 2011 Annual Report Download - page 111
Download and view the complete annual report
Please find page 111 of the 2011 Burger King annual report below. You can navigate through the pages in the report by either clicking on the pages listed below, or by using the keyword search tool below to find specific information within the annual report.-
 1
1 -
2
-
3
-
4
-
5
-
6
-
7
-
8
-
9
-
10
-
11
-
12
-
13
-
14
-
15
-
16
-
17
-
18
-
19
-
20
-
21
-
22
-
23
-
24
-
25
-
26
-
27
-
28
-
29
-
30
-
31
-
32
-
33
-
34
-
35
-
36
-
37
-
38
-
39
-
40
-
41
-
42
-
43
-
44
-
45
-
46
-
47
-
48
-
49
-
50
-
51
-
52
-
53
-
54
-
55
-
56
-
57
-
58
-
59
-
60
-
61
-
62
-
63
-
64
-
65
-
66
-
67
-
68
-
69
-
70
-
71
-
72
-
73
-
74
-
75
-
76
-
77
-
78
-
79
-
80
-
81
-
82
-
83
-
84
-
85
-
86
-
87
-
88
-
89
-
90
-
91
-
92
-
93
-
94
-
95
-
96
-
97
-
98
-
99
-
100
-
 101
101 -
 102
102 -
 103
103 -
 104
104 -
 105
105 -
 106
106 -
 107
107 -
 108
108 -
 109
109 -
 110
110 -
 111
111 -
 112
112 -
 113
113 -
 114
114 -
 115
115 -
 116
116 -
 117
117 -
 118
118 -
 119
119 -
 120
120 -
 121
121 -
122
-
123
-
124
-
125
-
126
-
127
-
128
-
129
-
130
-
131
-
132
-
133
-
134
-
135
-
136
-
137
-
138
-
139
-
140
-
141
-
142
-
143
-
144
-
145
-
146
-
147
-
148
-
149
-
150
-
151
-
152
 |
 |
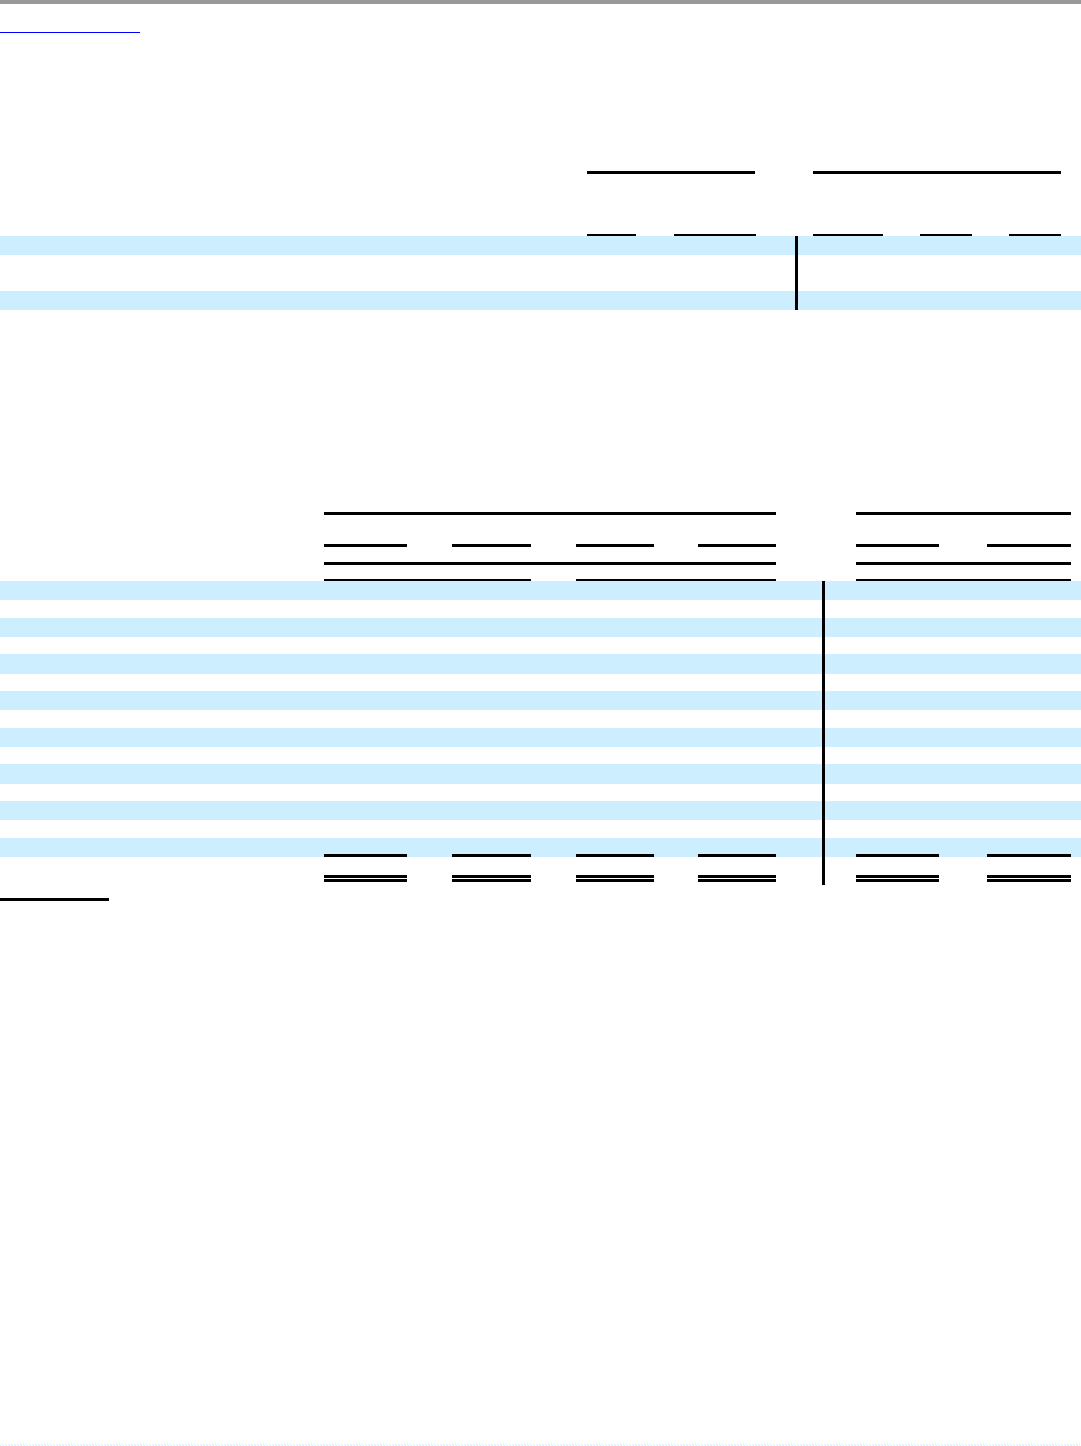
Table of Contents
BURGER KING HOLDINGS, INC. AND SUBSIDIARIES
Notes to Consolidated Financial Statements — (Continued)
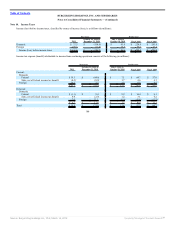
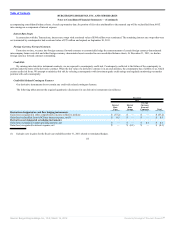
The assumed healthcare cost trend rates are as follows:
Successor Predecessor
2011
October 19,
2010 to
December 31,
2010
July 1,
2010 to
October 18,
2010
Fiscal
2010
Fiscal
2009
Healthcare cost trend rate assumed for next year 8.00% 8.00% 8.00% 8.00% 8.50%
Rate to which the cost trend rate is assumed to decline
(the ultimate trend rate) 5.00% 5.00% 5.00% 5.00% 5.00%
Year that the rate reaches the ultimate trend rate 2020 2020 2020 2020 2016
Assumed healthcare cost trend rates do not have a significant effect on the amounts reported for the postretirement healthcare plans, since a one-percentage
point increase or decrease in the assumed healthcare cost trend rate would have a minimal effect on service and interest cost for the postretirement obligation.
Plan Assets
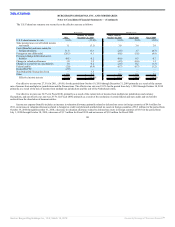
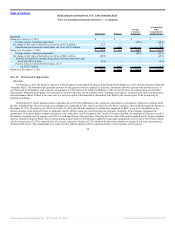
The fair value of the major categories of pension plan assets for U.S. and International Pension Plans at December 31, 2011 is presented below (in
millions):
Successor Predecessor
U.S.
Pension Plans
International
Pension Plan
U.S.
Pension Plan
Internation
Pension Plan
U.S.
Pension Plans
International
Pension Plans
As of December 31, As of June 30,
2011 2010 2010
Level 2
Cash and Cash equivalents(a) $ 1.0 $ — $ 8.0 $ 0.2 $ 7.7 $ 0.3
Equity Securities(b):
U.S. 64.4 3.6 58.1 4.0 49.2 3.2
Non — U.S. 13.3 10.5 13.6 10.7 11.8 8.3
Fixed Income(b):
Corporate Bonds and Notes 24.9 — 24.1 — 20.6 —
U.S. Government Treasuries 6.2 — 7.2 — 6.3 —
International Debt 7.6 — 5.7 — 4.9 —
Mortgage-Backed Securities 1.3 — 0.8 — 4.5 —
U.S. Government Agencies 2.3 — 1.8 — 1.9 —
Asset-Backed Securities 0.3 — 0.3 — 1.0 —
Municipal Bonds 3.1 — 1.1 — 0.8 —
Non-U.S. Bonds 0.8 6.6 0.3 6.8 0.2 6.2
Other(c) 3.8 0.4 1.1 0.4 0.8 0.3
Total fair value of plan assets $ 129.0 $ 21.1 $ 122.1 $ 22.1 $ 109.7 $ 18.3
(a) Short-term investments in money market funds and short term receivables for investments sold
110
Source: Burger King Holdings Inc, 10-K, March 14, 2012 Powered by Morningstar® Document Research℠