Burger King 2011 Annual Report Download - page 110
Download and view the complete annual report
Please find page 110 of the 2011 Burger King annual report below. You can navigate through the pages in the report by either clicking on the pages listed below, or by using the keyword search tool below to find specific information within the annual report.-
 1
1 -
2
-
3
-
4
-
5
-
6
-
7
-
8
-
9
-
10
-
11
-
12
-
13
-
14
-
15
-
16
-
17
-
18
-
19
-
20
-
21
-
22
-
23
-
24
-
25
-
26
-
27
-
28
-
29
-
30
-
31
-
32
-
33
-
34
-
35
-
36
-
37
-
38
-
39
-
40
-
41
-
42
-
43
-
44
-
45
-
46
-
47
-
48
-
49
-
50
-
51
-
52
-
53
-
54
-
55
-
56
-
57
-
58
-
59
-
60
-
61
-
62
-
63
-
64
-
65
-
66
-
67
-
68
-
69
-
70
-
71
-
72
-
73
-
74
-
75
-
76
-
77
-
78
-
79
-
80
-
81
-
82
-
83
-
84
-
85
-
86
-
87
-
88
-
89
-
90
-
91
-
92
-
93
-
94
-
95
-
96
-
97
-
98
-
99
-
 100
100 -
 101
101 -
 102
102 -
 103
103 -
 104
104 -
 105
105 -
 106
106 -
 107
107 -
 108
108 -
 109
109 -
 110
110 -
 111
111 -
 112
112 -
 113
113 -
 114
114 -
 115
115 -
 116
116 -
 117
117 -
 118
118 -
 119
119 -
 120
120 -
121
-
122
-
123
-
124
-
125
-
126
-
127
-
128
-
129
-
130
-
131
-
132
-
133
-
134
-
135
-
136
-
137
-
138
-
139
-
140
-
141
-
142
-
143
-
144
-
145
-
146
-
147
-
148
-
149
-
150
-
151
-
152
 |
 |

Table of Contents
BURGER KING HOLDINGS, INC. AND SUBSIDIARIES
Notes to Consolidated Financial Statements — (Continued)
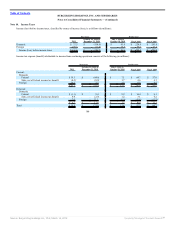
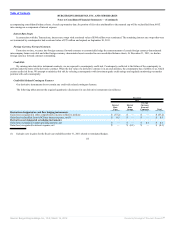
International Pension Plans
Successor Predecessor
2011
October 19,
2010 to
December 31,
2010
July 1,
2010 to
October 18,
2010
Fiscal
2010
Fiscal
2009
Discount rate as of year-end 4.82% 5.35% 4.98% 5.17% 6.00%
Range of compensation rate increase 3.44% 3.80% 3.52% 3.71% 3.53%
The discount rate used in the calculation of the benefit obligation at December 31, 2011 for the U.S. Plans is derived from a yield curve comprised of the
yields of approximately 540 market-weighted corporate bonds, rated AA on average by Moody’s, Standard & Poors, and Fitch, matched against the cash flows of
the U.S. Plans. The discount rate used in the calculation of the benefit obligation for the U.S. Plans in prior periods was derived from a yield curve comprised of
the yields of approximately 360 equally-weighted corporate bonds, rated AA or better by Moody’s or Standard & Poors, matched against the cash flows of the
U.S. Plans.
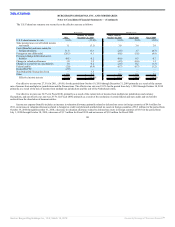
The weighted-average assumptions used in computing the net periodic benefit cost of the U.S. Pension Plans and the U.S. Retiree Medical Plan are as
follows:
U.S. Pension Plans U.S. Retiree Medical Plan
Successor Predecessor Successor Predecessor
2011
October 19,
2010 to
December 31,
2010
July 1,
2010 to
October 18,
2010
Fiscal
2010
Fiscal
2009 2011
October 19,
2010 to
December 31,
2010
July 1,
2010 to
October 18,
2010
Fiscal
2010
Fiscal
2009
Discount rate 5.35% 5.06% 5.16% 6.37% 6.10% 5.35% 5.06% 5.16% 6.37% 6.10%
Expected long-term
rate of return on
plan assets 7.50% 7.50% 7.50% 7.50% 8.25% N/A N/A N/A N/A N/A
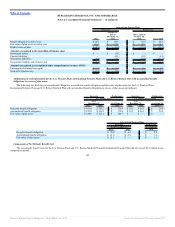
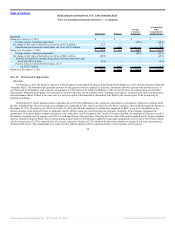
International Pension Plans
Successor Predecessor
2011
October 19,
2010 to
December 31,
2010
July 1,
2010 to
October 18,
2010
Fiscal
2010
Fiscal
2009
Discount rate 5.38% 5.15% 5.09% 6.07% 5.89%
Range of compensation rate increase 3.79% 3.66% 3.58% 3.57% 3.88%
Expected long-term rate of return on plan assets 6.49% 6.10% 6.37% 6.42% 6.51%
The expected long-term rate of return on plan assets is determined by expected future returns on the asset categories in target investment allocation. These
expected returns are based on historical returns for each asset’s category adjusted for an assessment of current market conditions.
109
Source: Burger King Holdings Inc, 10-K, March 14, 2012 Powered by Morningstar® Document Research℠