Burger King 2011 Annual Report Download - page 121
Download and view the complete annual report
Please find page 121 of the 2011 Burger King annual report below. You can navigate through the pages in the report by either clicking on the pages listed below, or by using the keyword search tool below to find specific information within the annual report.-
 1
1 -
2
-
3
-
4
-
5
-
6
-
7
-
8
-
9
-
10
-
11
-
12
-
13
-
14
-
15
-
16
-
17
-
18
-
19
-
20
-
21
-
22
-
23
-
24
-
25
-
26
-
27
-
28
-
29
-
30
-
31
-
32
-
33
-
34
-
35
-
36
-
37
-
38
-
39
-
40
-
41
-
42
-
43
-
44
-
45
-
46
-
47
-
48
-
49
-
50
-
51
-
52
-
53
-
54
-
55
-
56
-
57
-
58
-
59
-
60
-
61
-
62
-
63
-
64
-
65
-
66
-
67
-
68
-
69
-
70
-
71
-
72
-
73
-
74
-
75
-
76
-
77
-
78
-
79
-
80
-
81
-
82
-
83
-
84
-
85
-
86
-
87
-
88
-
89
-
90
-
91
-
92
-
93
-
94
-
95
-
96
-
97
-
98
-
99
-
100
-
101
-
102
-
103
-
104
-
105
-
106
-
107
-
108
-
109
-
110
-
 111
111 -
 112
112 -
 113
113 -
 114
114 -
 115
115 -
 116
116 -
 117
117 -
 118
118 -
 119
119 -
 120
120 -
 121
121 -
 122
122 -
 123
123 -
 124
124 -
 125
125 -
 126
126 -
 127
127 -
 128
128 -
 129
129 -
 130
130 -
 131
131 -
132
-
133
-
134
-
135
-
136
-
137
-
138
-
139
-
140
-
141
-
142
-
143
-
144
-
145
-
146
-
147
-
148
-
149
-
150
-
151
-
152
 |
 |

Table of Contents
BURGER KING HOLDINGS, INC. AND SUBSIDIARIES
Notes to Consolidated Financial Statements — (Continued)
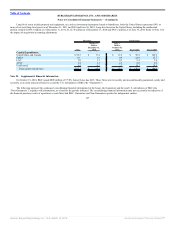
for Fiscal 2010 and $11.4 million for Fiscal 2009. The related excess tax benefits from stock options exercised were $1.1 million offset by $1.5 million shortfalls
recorded as operating cash flows for the period July 1, 2010 through October 18, 2010, $3.5 million for Fiscal 2010 and $3.3 million for Fiscal 2009.
Proceeds from stock options exercised were $4.0 million for the period July 1, 2010 through October 18, 2010, $4.2 million for Fiscal 2010 and
$3.0 million for Fiscal 2009.
The weighted average grant date fair value of nonvested shares granted was $16.96 during the period July 1, 2010 through October 18, 2010, $18.35 for
Fiscal 2010 and $25.10 for Fiscal 2009. The total intrinsic value of grants which vested and settled was $9.1 million during the period July 1, 2010 through
October 18, 2010, $9.6 million for Fiscal 2010 and $1.1 million for Fiscal 2009.
The fair value of shares withheld by us to meet employees’ minimum statutory withholding tax requirements on the settlement of RSU’s was $2.5 million
during the period July 1, 2010 through October 18, 2010, $2.7 million for Fiscal 2010 and $0.3 million for Fiscal 2009
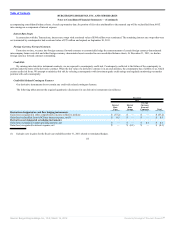
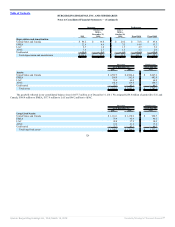
Note 16. Franchise and Property Revenues
Franchise and property revenues consist of the following (in millions):
Successor Predecessor
2011
October 19,
2010 to
December 31,
2010
July 1,
2010 to
October 18,
2010 Fiscal 2010 Fiscal 2009
Franchise royalties $ 565.5 $ 107.4 $ 165.2 $ 529.5 $ 518.2
Initial franchise fees 13.3 2.6 1.7 10.9 13.8
Renewal franchise fees and other related fees 7.0 1.6 2.3 8.8 11.4
Property revenues 111.2 23.5 34.0 113.7 113.5
Total $ 697.0 $ 135.1 $ 203.2 $ 662.9 $ 656.9
Refer to Note 9 for the components of property revenues.
120
Source: Burger King Holdings Inc, 10-K, March 14, 2012 Powered by Morningstar® Document Research℠