Burger King 2011 Annual Report Download - page 129
Download and view the complete annual report
Please find page 129 of the 2011 Burger King annual report below. You can navigate through the pages in the report by either clicking on the pages listed below, or by using the keyword search tool below to find specific information within the annual report.-
 1
1 -
2
-
3
-
4
-
5
-
6
-
7
-
8
-
9
-
10
-
11
-
12
-
13
-
14
-
15
-
16
-
17
-
18
-
19
-
20
-
21
-
22
-
23
-
24
-
25
-
26
-
27
-
28
-
29
-
30
-
31
-
32
-
33
-
34
-
35
-
36
-
37
-
38
-
39
-
40
-
41
-
42
-
43
-
44
-
45
-
46
-
47
-
48
-
49
-
50
-
51
-
52
-
53
-
54
-
55
-
56
-
57
-
58
-
59
-
60
-
61
-
62
-
63
-
64
-
65
-
66
-
67
-
68
-
69
-
70
-
71
-
72
-
73
-
74
-
75
-
76
-
77
-
78
-
79
-
80
-
81
-
82
-
83
-
84
-
85
-
86
-
87
-
88
-
89
-
90
-
91
-
92
-
93
-
94
-
95
-
96
-
97
-
98
-
99
-
100
-
101
-
102
-
103
-
104
-
105
-
106
-
107
-
108
-
109
-
110
-
111
-
112
-
113
-
114
-
115
-
116
-
117
-
118
-
 119
119 -
 120
120 -
 121
121 -
 122
122 -
 123
123 -
 124
124 -
 125
125 -
 126
126 -
 127
127 -
 128
128 -
 129
129 -
 130
130 -
 131
131 -
 132
132 -
 133
133 -
 134
134 -
 135
135 -
 136
136 -
 137
137 -
 138
138 -
 139
139 -
140
-
141
-
142
-
143
-
144
-
145
-
146
-
147
-
148
-
149
-
150
-
151
-
152
 |
 |

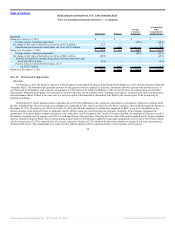
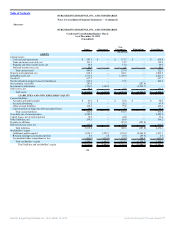
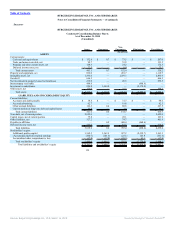
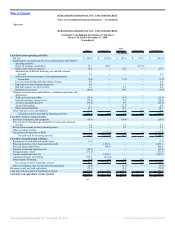
Table of Contents
BURGER KING HOLDINGS, INC. AND SUBSIDIARIES
Notes to Consolidated Financial Statements — (Continued)
Successor
BURGER KING HOLDINGS, INC. AND SUBSIDIARIES
Condensed Consolidating Balance Sheets
As of December 31, 2011
(Unaudited)
Issuer Guarantors
Non-
Guarantors Eliminations Consolidated
(In millions)
ASSETS
Current assets:
Cash and cash equivalents $ 287.1 $ — $ 171.7 $ — $ 458.8
Trade and notes receivable, net 101.1 — 51.7 — 152.8
Prepaids and other current assets, net 54.6 — 13.4 — 68.0
Deferred income taxes, net 42.0 — 1.1 — 43.1
Total current assets 484.8 — 237.9 — 722.7
Property and equipment, net 846.4 — 180.1 — 1,026.5
Intangible assets, net 1,572.4 — 1,250.9 — 2,823.3
Goodwill 657.7 — — — 657.7
Net investment in property leased to franchisees 222.9 — 19.3 — 242.2
Intercompany receivable 287.0 — — (287.0) —
Investment in subsidiaries 1,110.5 1,449.2 — (2,559.7) —
Other assets, net 83.3 — 27.8 — 111.1
Total assets $ 5,265.0 $ 1,449.2 $ 1,716.0 $ (2,846.7) $ 5,583.5
LIABILITIES AND STOCKHOLDERS’ EQUITY
Current liabilities:
Accounts and drafts payable $ 61.6 $ — $ 36.8 $ — $ 98.4
Accrued advertising 71.2 — 26.2 — 97.4
Other accrued liabilities 162.6 — 79.6 — 242.2
Current portion of long term debt and capital leases 30.8 — 2.7 — 33.5
Total current liabilities 326.2 — 145.3 — 471.5
Term debt, net of current portion 2,585.9 — — — 2,585.9
Capital leases, net of current portion 70.6 — 24.8 — 95.4
Other liabilities, net 299.3 — 66.9 — 366.2
Payables to affiliates — — 287.0 (287.0) —
Deferred income taxes, net 533.8 — 81.5 — 615.3
Total liabilities 3,815.8 — 605.5 (287.0) 4,134.3
Stockholder’s equity:
Additional paid-in capital 1,556.1 1,557.1 1,138.4 (2,694.5) 1,557.1
Retained earnings (accumulated deficit) 6.4 5.4 63.4 (69.8) 5.4
Accumulated other comprehensive loss (113.3) (113.3) (91.3) 204.6 (113.3)
Total stockholder’s equity 1,449.2 1,449.2 1,110.5 (2,559.7) 1,449.2
Total liabilities and stockholder’s equity $ 5,265.0 $ 1,449.2 $ 1,716.0 $ (2,846.7) $ 5,583.5
128
Source: Burger King Holdings Inc, 10-K, March 14, 2012 Powered by Morningstar® Document Research℠