Burger King 2011 Annual Report Download - page 32
Download and view the complete annual report
Please find page 32 of the 2011 Burger King annual report below. You can navigate through the pages in the report by either clicking on the pages listed below, or by using the keyword search tool below to find specific information within the annual report.-
 1
1 -
2
-
3
-
4
-
5
-
6
-
7
-
8
-
9
-
10
-
11
-
12
-
13
-
14
-
15
-
16
-
17
-
18
-
19
-
20
-
21
-
 22
22 -
 23
23 -
 24
24 -
 25
25 -
 26
26 -
 27
27 -
 28
28 -
 29
29 -
 30
30 -
 31
31 -
 32
32 -
 33
33 -
 34
34 -
 35
35 -
 36
36 -
 37
37 -
 38
38 -
 39
39 -
 40
40 -
 41
41 -
 42
42 -
43
-
44
-
45
-
46
-
47
-
48
-
49
-
50
-
51
-
52
-
53
-
54
-
55
-
56
-
57
-
58
-
59
-
60
-
61
-
62
-
63
-
64
-
65
-
66
-
67
-
68
-
69
-
70
-
71
-
72
-
73
-
74
-
75
-
76
-
77
-
78
-
79
-
80
-
81
-
82
-
83
-
84
-
85
-
86
-
87
-
88
-
89
-
90
-
91
-
92
-
93
-
94
-
95
-
96
-
97
-
98
-
99
-
100
-
101
-
102
-
103
-
104
-
105
-
106
-
107
-
108
-
109
-
110
-
111
-
112
-
113
-
114
-
115
-
116
-
117
-
118
-
119
-
120
-
121
-
122
-
123
-
124
-
125
-
126
-
127
-
128
-
129
-
130
-
131
-
132
-
133
-
134
-
135
-
136
-
137
-
138
-
139
-
140
-
141
-
142
-
143
-
144
-
145
-
146
-
147
-
148
-
149
-
150
-
151
-
152
 |
 |

Table of Contents
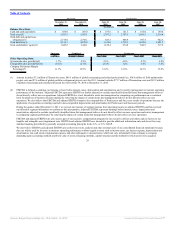
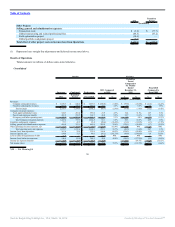
(d) Represents severance related costs, compensation costs for overlap staffing, travel expenses, consulting and training costs incurred in connection
with our efforts to expand and enhance our U.S. field organization. See “Management’s Discussion and Analysis of Financial Condition and Results
of Operations — Recent Events and Factors Affecting Comparability — Field Optimization Project” in Part II, Item 7 of this report.
(e) Represents costs associated with an ongoing project to realign our global restaurant portfolio by refranchising our Company restaurants and
establishing strategic partners and joint ventures to accelerate development. These costs primarily include severance related costs and professional
service fees. See “Management’s Discussion and Analysis of Financial Condition and Results of Operations — Recent Events and Factors Affecting
Comparability — Global Portfolio Realignment Project” in Part II, Item 7 of this report.
(f) Represents income and expenses that are not directly derived from our primary business such as gains and losses on asset and business disposals,
write-offs associated with restaurant closures, impairment charges, charges recorded in connection with acquisitions of franchise operations, gains
and losses on currency transactions, gains and losses on foreign currency forward contracts and other miscellaneous items.
(3) Amounts as of December 31, 2011 and 2010 reflect the application of acquisition accounting as a result of the Acquisition. Refer to Note 1 to our audited
Consolidated Financial Statements included in Part II, Item 8 “Financial Statements and Supplementary Data”.
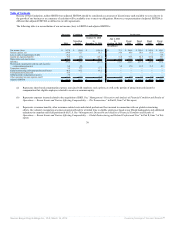
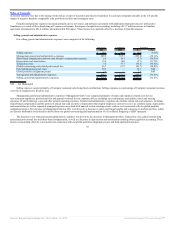
(4) Comparable sales growth and sales growth are analyzed on a constant currency basis, which means they are calculated by translating current year results at
prior year average exchange rates, to remove the effects of currency fluctuations from these trend analyses. We believe these constant currency measures
provide a more meaningful analysis of our business by identifying the underlying business trends, without distortion from the effect of foreign currency
movements.
(5) Unless otherwise stated, comparable sales growth and sales growth are presented on a system-wide basis, which means they include Company restaurants
and franchise restaurants. Franchise sales represent sales at all franchise restaurants and are revenues to our franchisees. We do not record franchise sales
as revenues. However, our royalty revenues are calculated based on a percentage of franchise sales. See “Management’s Discussion and Analysis of
Financial Condition and Results of Operations — Key Business Metrics” in Part II, Item 7 of this report.
(6) Comparable sales growth refers to the change in restaurant sales in one period from the same period in the prior year for restaurants that have been open
for thirteen months or longer.
(7) Company restaurant margin is derived by subtracting Company restaurant expenses from Company restaurant revenues, and is typically analyzed as a
percentage of Company restaurant revenues, a metric we refer to as Company restaurant margin percentage.
31
Source: Burger King Holdings Inc, 10-K, March 14, 2012 Powered by Morningstar® Document Research℠