Burger King 2011 Annual Report Download - page 42
Download and view the complete annual report
Please find page 42 of the 2011 Burger King annual report below. You can navigate through the pages in the report by either clicking on the pages listed below, or by using the keyword search tool below to find specific information within the annual report.-
 1
1 -
2
-
3
-
4
-
5
-
6
-
7
-
8
-
9
-
10
-
11
-
12
-
13
-
14
-
15
-
16
-
17
-
18
-
19
-
20
-
21
-
22
-
23
-
24
-
25
-
26
-
27
-
28
-
29
-
30
-
31
-
 32
32 -
 33
33 -
 34
34 -
 35
35 -
 36
36 -
 37
37 -
 38
38 -
 39
39 -
 40
40 -
 41
41 -
 42
42 -
 43
43 -
 44
44 -
 45
45 -
 46
46 -
 47
47 -
 48
48 -
 49
49 -
 50
50 -
 51
51 -
 52
52 -
53
-
54
-
55
-
56
-
57
-
58
-
59
-
60
-
61
-
62
-
63
-
64
-
65
-
66
-
67
-
68
-
69
-
70
-
71
-
72
-
73
-
74
-
75
-
76
-
77
-
78
-
79
-
80
-
81
-
82
-
83
-
84
-
85
-
86
-
87
-
88
-
89
-
90
-
91
-
92
-
93
-
94
-
95
-
96
-
97
-
98
-
99
-
100
-
101
-
102
-
103
-
104
-
105
-
106
-
107
-
108
-
109
-
110
-
111
-
112
-
113
-
114
-
115
-
116
-
117
-
118
-
119
-
120
-
121
-
122
-
123
-
124
-
125
-
126
-
127
-
128
-
129
-
130
-
131
-
132
-
133
-
134
-
135
-
136
-
137
-
138
-
139
-
140
-
141
-
142
-
143
-
144
-
145
-
146
-
147
-
148
-
149
-
150
-
151
-
152
 |
 |

Table of Contents
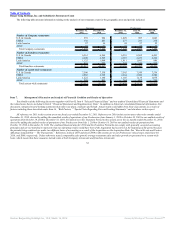
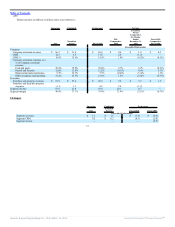
Other operating income (expense), net
Our other operating income (expense), net was comprised of the following:
Combined Predecessor
Transition
Period
For the Six
Months
Ended
December 31,
2009
Net losses on disposal of assets, restaurant closures and refranchisings $ 2.6 $ 1.0
Litigation settlements and reserves, net 6.8 0.7
Foreign exchange net (gains) losses (22.8) 1.1
Loss from unconsolidated affiliates 0.8 —
Other, net 0.3 2.3
Other operating (income) expenses, net $ (12.3) $ 5.1
Interest expense, net and loss on early extinguishment of debt
Interest expense, net increased due to a $13.5 million bridge loan fee related to the Transactions and an increase in borrowings and interest rates. The
weighted average interest rate for the period October 19, 2010 to December 31, 2010, related to the $1,510.0 million tranche was 6.82% and related to the
€250.0 million tranche was 7.11% under the Term Loan Facility, which included the effect of interest rate caps on 100% of our term debt. The weighted average
interest rate for the period July 1, 2010 to October 18, 2010 was 4.4% which included the impact of interest rate swaps on an average of 77% of our term debt.
Income tax expense
Our effective tax rate was (23.4%) in the Transition Period compared to 33.9% for the six months ended December 31, 2009 as a result of the current mix
of income from multiple tax jurisdictions and the Transactions.
Fiscal 2010 compared to Fiscal 2009
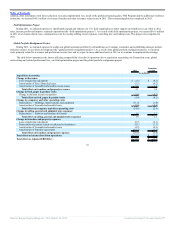
Company restaurants
Company restaurant revenues decreased due to the net refranchising of 52 Company restaurants and the effects of negative Company comparable sales
growth. These factors were partially offset by favorable FX impact and Company NRG.
CRM % decreased due to sales deleverage of our fixed payroll and employee benefits and occupancy and other operating costs driven by negative
Company comparable sales growth and an increase in depreciation resulting from an increase in depreciable assets and strategic restaurant initiatives, such as our
reimaging program and our new POS system. These factors were partially offset by favorable adjustments to our self-insurance reserve in the U.S., net decreases
in commodity costs in the U.S. and Canada and strategic pricing initiatives.
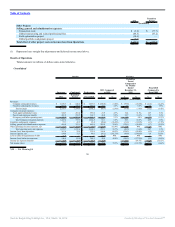
Franchise and Property
The increase in franchise and property revenues was driven by favorable FX impact, royalties derived from positive franchise NRG and a higher effective
royalty rate in the U.S. and LAC. These factors were partially offset by the impact of negative franchise comparable sales growth on royalties and contingent
rents. Franchise and property expenses increased primarily as a result of additional restaurants leased or subleased to franchisees due to the net refranchising of
Company restaurants and franchise NRG.
41
Source: Burger King Holdings Inc, 10-K, March 14, 2012 Powered by Morningstar® Document Research℠