Burger King 2011 Annual Report Download - page 30
Download and view the complete annual report
Please find page 30 of the 2011 Burger King annual report below. You can navigate through the pages in the report by either clicking on the pages listed below, or by using the keyword search tool below to find specific information within the annual report.-
 1
1 -
2
-
3
-
4
-
5
-
6
-
7
-
8
-
9
-
10
-
11
-
12
-
13
-
14
-
15
-
16
-
17
-
18
-
19
-
 20
20 -
 21
21 -
 22
22 -
 23
23 -
 24
24 -
 25
25 -
 26
26 -
 27
27 -
 28
28 -
 29
29 -
 30
30 -
 31
31 -
 32
32 -
 33
33 -
 34
34 -
 35
35 -
 36
36 -
 37
37 -
 38
38 -
 39
39 -
 40
40 -
41
-
42
-
43
-
44
-
45
-
46
-
47
-
48
-
49
-
50
-
51
-
52
-
53
-
54
-
55
-
56
-
57
-
58
-
59
-
60
-
61
-
62
-
63
-
64
-
65
-
66
-
67
-
68
-
69
-
70
-
71
-
72
-
73
-
74
-
75
-
76
-
77
-
78
-
79
-
80
-
81
-
82
-
83
-
84
-
85
-
86
-
87
-
88
-
89
-
90
-
91
-
92
-
93
-
94
-
95
-
96
-
97
-
98
-
99
-
100
-
101
-
102
-
103
-
104
-
105
-
106
-
107
-
108
-
109
-
110
-
111
-
112
-
113
-
114
-
115
-
116
-
117
-
118
-
119
-
120
-
121
-
122
-
123
-
124
-
125
-
126
-
127
-
128
-
129
-
130
-
131
-
132
-
133
-
134
-
135
-
136
-
137
-
138
-
139
-
140
-
141
-
142
-
143
-
144
-
145
-
146
-
147
-
148
-
149
-
150
-
151
-
152
 |
 |

Table of Contents
Successor Predecessor
December 31,
2011
December 31,
2010
June 30,
2010
June 30,
2009
June 30,
2008
June 30,
2007
(In millions)
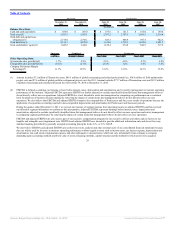
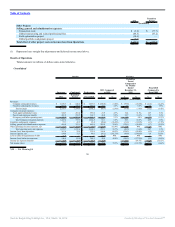
Balance Sheet Data:
Cash and cash equivalents $ 458.8 $ 207.0 $ 187.6 $ 121.7 $ 166.0 $ 169.4
Total assets(3) 5,583.5 5,683.1 2,747.2 2,707.1 2,686.5 2,516.8
Total debt and capital lease
obligations(3) 2,714.8 2,792.1 826.3 888.9 947.4 942.5
Total liabilities(3) 4,134.3 4,239.0 1,618.8 1,732.3 1,842.0 1,801.2
Total stockholders’ equity(3) 1,449.2 1,444.1 1,128.4 974.8 844.5 715.6
Successor Combined Predecessor
2011 Transition Period Fiscal 2010 Fiscal 2009 Fiscal 2008 Fiscal 2007
Other Operating Data:
Systemwide sales growth(4)(5) 1.7% 2.2% 2.1% 4.2% 8.3% 4.9%
Comparable sales growth(4)(5)(6) (0.5)% (2.7)% (2.3)% 1.2% 5.4% 3.4%
Company Restaurant Margin
Percentage(7) 11.7% 12.9% 12.2% 12.6% 14.3% 15.0%
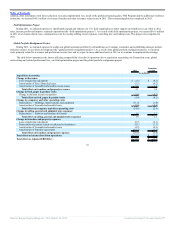
(1) Amount includes $3.2 million of Transaction costs, $46.5 million of global restructuring and related professional fees, $10.6 million of field optimization
project costs and $7.6 million of global portfolio realignment project costs for 2011. Amount includes $77.7 million of Transaction costs and $67.2 million
of global restructuring and related professional fees for October 19, 2010 to December 31, 2010.
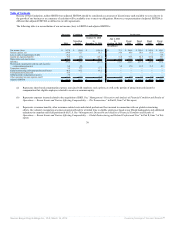
(2) EBITDA is defined as earnings (net income or loss) before interest, taxes, depreciation and amortization, and is used by management to measure operating
performance of the business. Adjusted EBITDA represents EBITDA as further adjusted to exclude specifically identified items that management believes
do not directly reflect our core operations. Adjusted EBITDA is a tool intended to assist our management in comparing our performance on a consistent
basis for purposes of business decision-making by removing the impact of certain items that management believes do not directly reflect our core
operations. We also believe that EBITDA and adjusted EBITDA improve the comparability of Predecessor and Successor results of operations because the
application of acquisition accounting resulted in non-comparable depreciation and amortization for Predecessor and Successor periods.
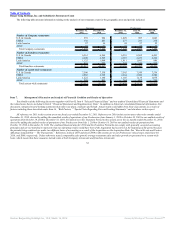
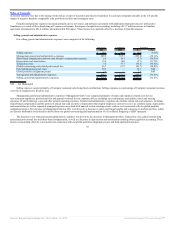
During the quarter ended December 31, 2011, we revised our measure of segment income from operating income to adjusted EBITDA and have revised
our historical segment information to conform to this presentation. Adjusted EBITDA represents earnings before interest, taxes, depreciation and
amortization, adjusted to exclude specifically identified items that management believes do not directly reflect our core operations and assists management
in comparing segment performance by removing the impact of certain items that management believes do not reflect our core operations.
EBITDA and adjusted EBITDA are also used as part of our incentive compensation program for our executive officers and others and are factors in our
tangible and intangible asset impairment tests. EBITDA and adjusted EBITDA are intended to provide additional information only and do not have any
standard meaning prescribed by generally accepted accounting principles in the U.S., or U.S. GAAP.
We also believe EBITDA and adjusted EBITDA are useful to investors, analysts and other external users of our consolidated financial statements because
they are widely used by investors to measure operating performance without regard to items such as income taxes, net interest expense, depreciation and
amortization, non-cash stock compensation expense and other infrequent or unusual items, which can vary substantially from company to company
depending upon accounting methods and book value of assets, financing methods, capital structure and the method by which assets were acquired.
29
Source: Burger King Holdings Inc, 10-K, March 14, 2012 Powered by Morningstar® Document Research℠