Burger King 2011 Annual Report Download - page 73
Download and view the complete annual report
Please find page 73 of the 2011 Burger King annual report below. You can navigate through the pages in the report by either clicking on the pages listed below, or by using the keyword search tool below to find specific information within the annual report.-
 1
1 -
2
-
3
-
4
-
5
-
6
-
7
-
8
-
9
-
10
-
11
-
12
-
13
-
14
-
15
-
16
-
17
-
18
-
19
-
20
-
21
-
22
-
23
-
24
-
25
-
26
-
27
-
28
-
29
-
30
-
31
-
32
-
33
-
34
-
35
-
36
-
37
-
38
-
39
-
40
-
41
-
42
-
43
-
44
-
45
-
46
-
47
-
48
-
49
-
50
-
51
-
52
-
53
-
54
-
55
-
56
-
57
-
58
-
59
-
60
-
61
-
62
-
 63
63 -
 64
64 -
 65
65 -
 66
66 -
 67
67 -
 68
68 -
 69
69 -
 70
70 -
 71
71 -
 72
72 -
 73
73 -
 74
74 -
 75
75 -
 76
76 -
 77
77 -
 78
78 -
 79
79 -
 80
80 -
 81
81 -
 82
82 -
 83
83 -
84
-
85
-
86
-
87
-
88
-
89
-
90
-
91
-
92
-
93
-
94
-
95
-
96
-
97
-
98
-
99
-
100
-
101
-
102
-
103
-
104
-
105
-
106
-
107
-
108
-
109
-
110
-
111
-
112
-
113
-
114
-
115
-
116
-
117
-
118
-
119
-
120
-
121
-
122
-
123
-
124
-
125
-
126
-
127
-
128
-
129
-
130
-
131
-
132
-
133
-
134
-
135
-
136
-
137
-
138
-
139
-
140
-
141
-
142
-
143
-
144
-
145
-
146
-
147
-
148
-
149
-
150
-
151
-
152
 |
 |

Table of Contents
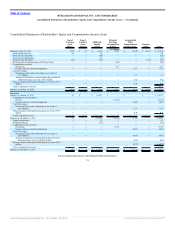
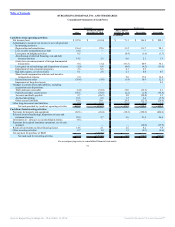
BURGER KING HOLDINGS, INC. AND SUBSIDIARIES
Consolidated Statements of Operations
Successor Predecessor
2011
October 19, 2010 to
December 31, 2010
July 1, 2010 to
October 18, 2010 Fiscal 2010 Fiscal 2009
(In millions)
Revenues:
Company restaurant revenues $ 1,638.7 $ 331.7 $ 514.5 $ 1,839.3 $ 1,880.5
Franchise and property revenues 697.0 135.1 203.2 662.9 656.9
Total revenues 2,335.7 466.8 717.7 2,502.2 2,537.4
Company restaurant expenses:
Food, paper and product costs 524.7 102.8 162.6 585.0 603.7
Payroll and employee benefits 481.2 98.3 154.2 568.7 582.2
Occupancy and other operating costs 441.5 91.7 127.7 461.1 457.8
Total Company restaurant expenses 1,447.4 292.8 444.5 1,614.8 1,643.7
Franchise and property expenses 97.1 21.3 22.2 65.4 64.3
Selling, general and administrative expenses 416.9 230.0 153.1 489.8 488.1
Other operating (income) expenses, net 11.3 (8.7) (3.6) (0.7) 1.9
Total operating costs and expenses 1,972.7 535.4 616.2 2,169.3 2,198.0
Income (loss) from operations 363.0 (68.6) 101.5 332.9 339.4
Interest expense, net 194.8 58.1 14.6 48.6 54.6
Loss on early extinguishment of debt 21.4 — — — —
Income (loss) before income taxes 146.8 (126.7) 86.9 284.3 284.8
Income tax expense (benefit) 39.8 (25.1) 15.8 97.5 84.7
Net income (loss) $ 107.0 $ (101.6) $ 71.1 $ 186.8 $ 200.1
See accompanying notes to consolidated financial statements.
72
Source: Burger King Holdings Inc, 10-K, March 14, 2012 Powered by Morningstar® Document Research℠