Burger King 2011 Annual Report Download - page 60
Download and view the complete annual report
Please find page 60 of the 2011 Burger King annual report below. You can navigate through the pages in the report by either clicking on the pages listed below, or by using the keyword search tool below to find specific information within the annual report.-
 1
1 -
2
-
3
-
4
-
5
-
6
-
7
-
8
-
9
-
10
-
11
-
12
-
13
-
14
-
15
-
16
-
17
-
18
-
19
-
20
-
21
-
22
-
23
-
24
-
25
-
26
-
27
-
28
-
29
-
30
-
31
-
32
-
33
-
34
-
35
-
36
-
37
-
38
-
39
-
40
-
41
-
42
-
43
-
44
-
45
-
46
-
47
-
48
-
49
-
 50
50 -
 51
51 -
 52
52 -
 53
53 -
 54
54 -
 55
55 -
 56
56 -
 57
57 -
 58
58 -
 59
59 -
 60
60 -
 61
61 -
 62
62 -
 63
63 -
 64
64 -
 65
65 -
 66
66 -
 67
67 -
 68
68 -
 69
69 -
 70
70 -
71
-
72
-
73
-
74
-
75
-
76
-
77
-
78
-
79
-
80
-
81
-
82
-
83
-
84
-
85
-
86
-
87
-
88
-
89
-
90
-
91
-
92
-
93
-
94
-
95
-
96
-
97
-
98
-
99
-
100
-
101
-
102
-
103
-
104
-
105
-
106
-
107
-
108
-
109
-
110
-
111
-
112
-
113
-
114
-
115
-
116
-
117
-
118
-
119
-
120
-
121
-
122
-
123
-
124
-
125
-
126
-
127
-
128
-
129
-
130
-
131
-
132
-
133
-
134
-
135
-
136
-
137
-
138
-
139
-
140
-
141
-
142
-
143
-
144
-
145
-
146
-
147
-
148
-
149
-
150
-
151
-
152
 |
 |

Table of Contents
Under the terms of the Cap Agreements, if LIBOR/EURIBOR resets above the strike price, we will receive the net difference between the rate and the
strike price. In addition, on quarterly settlement dates, we remit the deferred premium payment (plus interest) to the counterparty, whether LIBOR/EURIBOR
resets above or below the strike price.
The Cap Agreements are designated as cash flow hedges. To the extent these hedges are effective in offsetting the variability of the variable interest
payments, changes in the derivatives’ fair value are not included in current earnings, but are included in the accumulated other comprehensive income (AOCI) in
the accompanying consolidated balance sheets. At each cap maturity date, the portion of the fair value attributable to the matured cap will be reclassified from
AOCI into earnings as a component of interest expense.
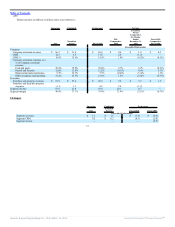
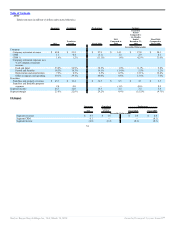
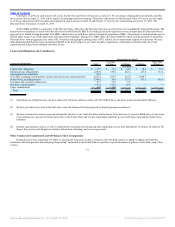
Comparative Cash Flows
Operating Activities
Cash provided by operating activities was $406.2 million in 2011 compared to cash provided by operating activities of $183.1 million in 2010. The
increase in cash provided by operating activities resulted primarily from a $75.9 million federal tax refund, a $107.2 million reduction in Management G&A, a
$95.2 million decrease in Transaction costs and global restructuring and related professional fees and a $35.9 million decrease in tax payments. These factors
were partially offset by a $117.5 million increase in interest payments and $10.6 million of field optimization project costs.
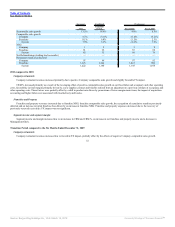
Cash used for operating activities was $5.2 million during the Transition Period, compared to $122.1 million provided during the same period in the prior
year. The decrease in cash provided by operating activities during the Transition Period resulted primarily from cash payments related to the Transaction costs
discussed above and changes in working capital of $12.0 million.
Cash provided by operating activities was $310.4 million in fiscal 2010, compared to $310.8 million in fiscal 2009.
Investing Activities
Cash used for investing activities was $41.4 million in 2011 compared to $3,430.7 million in 2010 driven primarily by cash used for the Acquisition in
2010 and a $51.0 million decrease in capital expenditures.
Cash used in investing activities increased to $3,349.4 million during the Transition Period, compared to $53.6 million during the same period in the prior
year, primarily as a result of $3,325.4 million paid for the acquisition of BKH, partially offset by a $17.2 million decrease in capital expenditures and
$10.0 million increase in cash generated from refranchisings and dispositions of assets.
Cash used in investing activities decreased to $134.9 million in fiscal 2010 compared to $242.0 million in fiscal 2009, primarily as a result of a
$53.7 million decrease in capital expenditures and a $53.9 million decrease in cash used for the acquisition of franchise restaurants.
Capital expenditures for new restaurants include the costs to build new Company restaurants as well as properties for new restaurants that we lease to
franchisees. Capital expenditures for existing restaurants consist of the purchase of real estate related to existing restaurants, maintenance capital required for
each Company restaurant to maintain its appearance in accordance with our standards and investments in new equipment and remodeling. Capital expenditures
made for existing restaurants also include investments we make in properties we lease or sublease to franchisees, including contributions we make towards
leasehold improvements completed
59
Source: Burger King Holdings Inc, 10-K, March 14, 2012 Powered by Morningstar® Document Research℠