Burger King 2011 Annual Report Download - page 50
Download and view the complete annual report
Please find page 50 of the 2011 Burger King annual report below. You can navigate through the pages in the report by either clicking on the pages listed below, or by using the keyword search tool below to find specific information within the annual report.-
 1
1 -
2
-
3
-
4
-
5
-
6
-
7
-
8
-
9
-
10
-
11
-
12
-
13
-
14
-
15
-
16
-
17
-
18
-
19
-
20
-
21
-
22
-
23
-
24
-
25
-
26
-
27
-
28
-
29
-
30
-
31
-
32
-
33
-
34
-
35
-
36
-
37
-
38
-
39
-
 40
40 -
 41
41 -
 42
42 -
 43
43 -
 44
44 -
 45
45 -
 46
46 -
 47
47 -
 48
48 -
 49
49 -
 50
50 -
 51
51 -
 52
52 -
 53
53 -
 54
54 -
 55
55 -
 56
56 -
 57
57 -
 58
58 -
 59
59 -
 60
60 -
61
-
62
-
63
-
64
-
65
-
66
-
67
-
68
-
69
-
70
-
71
-
72
-
73
-
74
-
75
-
76
-
77
-
78
-
79
-
80
-
81
-
82
-
83
-
84
-
85
-
86
-
87
-
88
-
89
-
90
-
91
-
92
-
93
-
94
-
95
-
96
-
97
-
98
-
99
-
100
-
101
-
102
-
103
-
104
-
105
-
106
-
107
-
108
-
109
-
110
-
111
-
112
-
113
-
114
-
115
-
116
-
117
-
118
-
119
-
120
-
121
-
122
-
123
-
124
-
125
-
126
-
127
-
128
-
129
-
130
-
131
-
132
-
133
-
134
-
135
-
136
-
137
-
138
-
139
-
140
-
141
-
142
-
143
-
144
-
145
-
146
-
147
-
148
-
149
-
150
-
151
-
152
 |
 |

Table of Contents
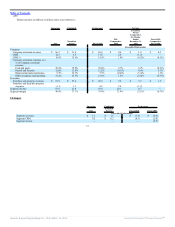
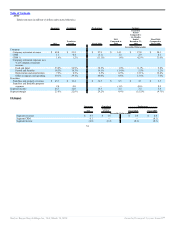
Key Business Metrics
Successor Combined Predecessor
2011
Transition
Period Fiscal 2010 Fiscal 2009
Systemwide sales growth 6.5% 7.7% 6.0% 8.5%
Comparable sales growth
Company 5.8% (1.4)% (2.3)% 0.0%
Franchise 4.1% (0.6)% 0.3% 2.4%
System 4.3% (0.7)% 0.0% 2.1%
NRG
Company (4) (1) (1) 1
Franchise 158 65 101 200
System 154 64 100 201
Net Refranchisings (trailing twelve months) 7 73 36 6
Restaurant counts at period end
Company 192 203 241 278
Franchise 2,690 2,525 2,439 2,302
System 2,882 2,728 2,680 2,580
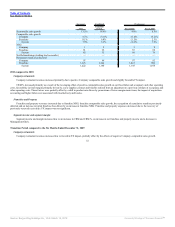
2011 compared to 2010
Company restaurants
Company restaurant revenues decreased due to the net refranchising of Company restaurants, driven by the sale of our Netherlands business during
September 2010 partially offset by the effects of positive Company comparable sales growth and favorable FX impact.
CRM % increased primarily as a result of the leveraging effect of positive Company comparable sales growth on our fixed labor and occupancy and other
operating costs, partially offset by lower food margins driven by higher commodity prices in Germany and the U.K., the sale of the Netherlands entity that
occurred in September 2010, wage rate increases in Germany and Spain and the impact of acquisition accounting.
Franchise and Property
Franchise and property revenues increased due to franchise fees and royalties derived from franchise NRG, franchise comparable sales growth and
favorable FX impact. These factors were partially offset by decreased rental income from a reduction in the number of properties leased or subleased to
franchisees.
Franchise and property expenses increased due to franchise agreement amortization of $8.3 million and unfavorable FX impact. These factors were
partially offset by a decrease in bad debt expense and decreased rent expense from a reduction in the number of properties leased or subleased to franchisees.
Segment income and segment margin
Segment income and margin increased due to a decrease in Management G&A, an increase in net franchise and property income and an increase in CRM
%.
Transition Period compared to the Six Months Ended December 31, 2009
Company restaurants
Company restaurant revenues decreased due to the net refranchising of Company restaurants in Germany and the Netherlands, the effects of negative
Company comparable sales growth and unfavorable FX impact.
49
Source: Burger King Holdings Inc, 10-K, March 14, 2012 Powered by Morningstar® Document Research℠