Burger King 2011 Annual Report Download - page 90
Download and view the complete annual report
Please find page 90 of the 2011 Burger King annual report below. You can navigate through the pages in the report by either clicking on the pages listed below, or by using the keyword search tool below to find specific information within the annual report.-
 1
1 -
2
-
3
-
4
-
5
-
6
-
7
-
8
-
9
-
10
-
11
-
12
-
13
-
14
-
15
-
16
-
17
-
18
-
19
-
20
-
21
-
22
-
23
-
24
-
25
-
26
-
27
-
28
-
29
-
30
-
31
-
32
-
33
-
34
-
35
-
36
-
37
-
38
-
39
-
40
-
41
-
42
-
43
-
44
-
45
-
46
-
47
-
48
-
49
-
50
-
51
-
52
-
53
-
54
-
55
-
56
-
57
-
58
-
59
-
60
-
61
-
62
-
63
-
64
-
65
-
66
-
67
-
68
-
69
-
70
-
71
-
72
-
73
-
74
-
75
-
76
-
77
-
78
-
79
-
 80
80 -
 81
81 -
 82
82 -
 83
83 -
 84
84 -
 85
85 -
 86
86 -
 87
87 -
 88
88 -
 89
89 -
 90
90 -
 91
91 -
 92
92 -
 93
93 -
 94
94 -
 95
95 -
 96
96 -
 97
97 -
 98
98 -
 99
99 -
 100
100 -
101
-
102
-
103
-
104
-
105
-
106
-
107
-
108
-
109
-
110
-
111
-
112
-
113
-
114
-
115
-
116
-
117
-
118
-
119
-
120
-
121
-
122
-
123
-
124
-
125
-
126
-
127
-
128
-
129
-
130
-
131
-
132
-
133
-
134
-
135
-
136
-
137
-
138
-
139
-
140
-
141
-
142
-
143
-
144
-
145
-
146
-
147
-
148
-
149
-
150
-
151
-
152
 |
 |
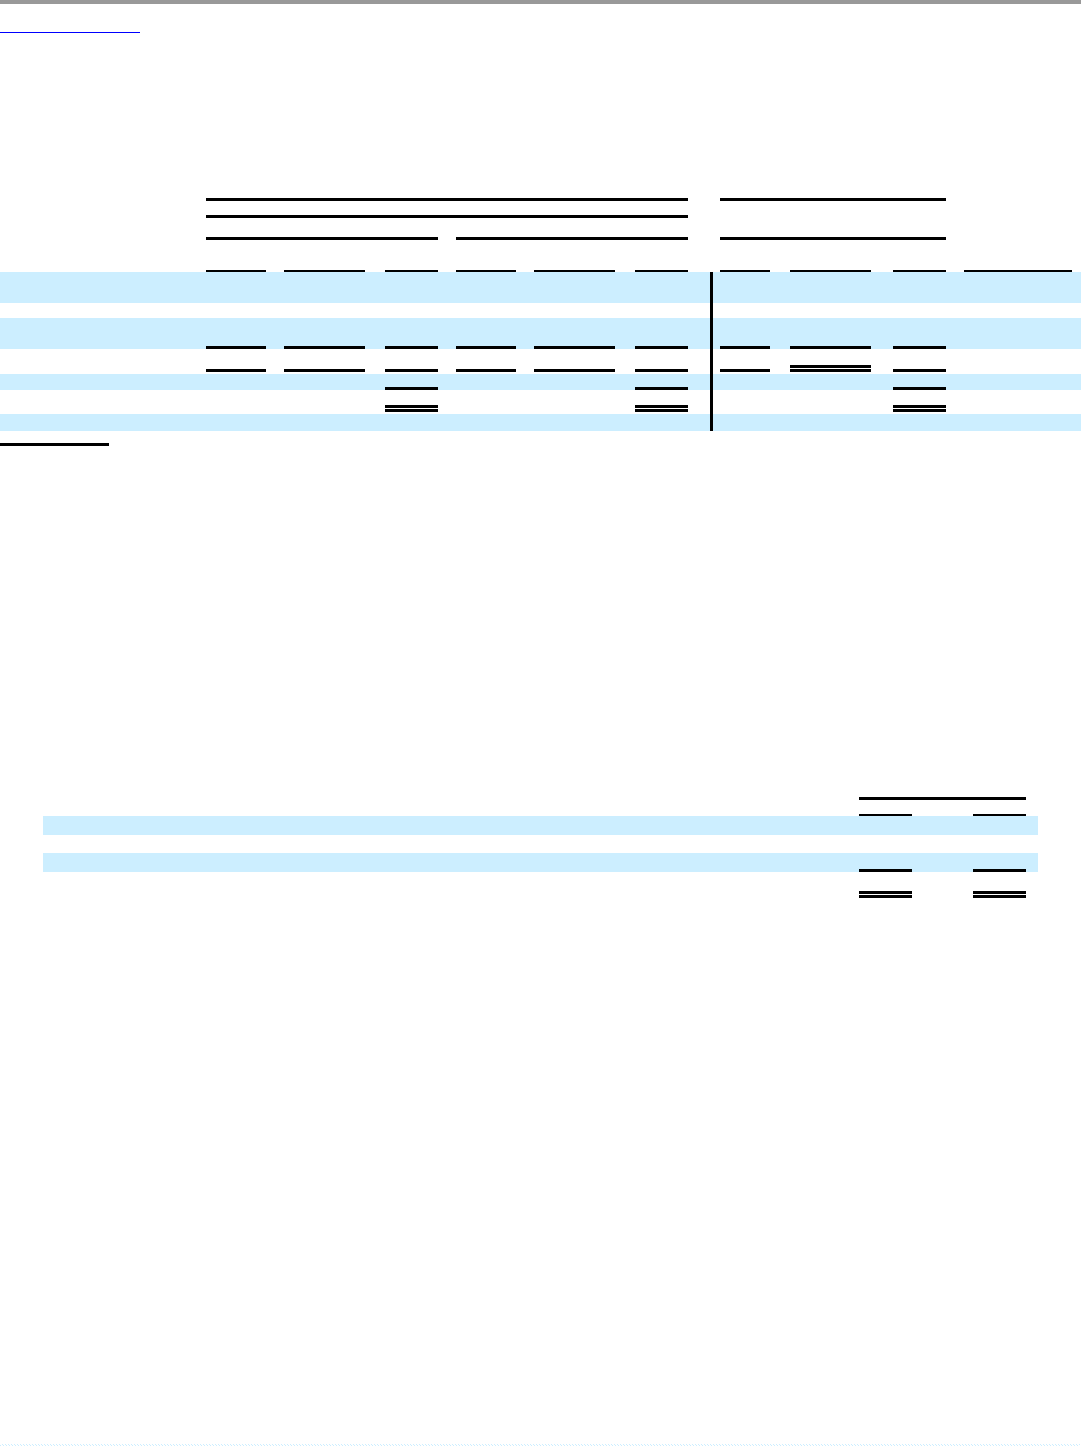
Table of Contents
BURGER KING HOLDINGS, INC. AND SUBSIDIARIES
Notes to Consolidated Financial Statements — (Continued)
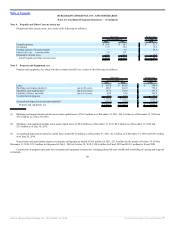
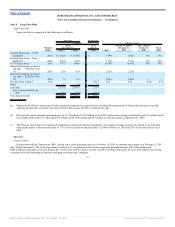
Note 6. Intangible Assets, net and Goodwill
Intangible assets consist of the following (in millions):
Successor Predecessor
As of December 31, As of June 30,
2010
2011 2010
Gross
Accumulated
Amortization Net Gross
Accumulated
Amortization Net Gross
Accumulated
Amortization Net
Weighted
Average Life(2)
Intangible assets subject to
amortization:
Franchise agreements(1) $ 482.3 $ (25.8) $ 456.5 $ 487.7 $ (4.5) $ 483.2 $ 142.2 $ (25.3) $ 116.9 23.3 Years
Favorable leases
174.2 (22.0) 152.2 175.8 (3.8) 172.0 49.1 (14.6) $ 34.5
12.6
Years
Subtotal 656.5 (47.8) 608.7 663.5 (8.3) 655.2 191.3 $ (39.9) 151.4
Brand $ 2,214.6 $ — $ 2,214.6 $ 2,238.7 $ — $ 2,238.7 $ 874.0 $ — $ 874.0
Intangible assets, net $ 2,823.3 $ 2,893.9 $ 1,025.4
Goodwill $ 657.7 $ 666.5 $ 31.0
(1) Includes reacquired franchise rights as of June 30, 2010.
(2) Weighted average life is as of December 31, 2011.
We recorded amortization expense on intangible assets of $40.2 million for 2011 and $8.2 million for the period of October 19, 2010 to December 31,
2010. The Predecessor recorded amortization expense on intangible assets of $2.7 million for the period July 1, 2010 to October 18, 2010, $8.7 million for Fiscal
2010, and $8.8 million for Fiscal 2009.
As of December 31, 2011, estimated future amortization expense on intangible assets is $38.2 million in 2012, $37.6 million in 2013, $36.6 million in
2014, $35.4 million in 2015, $34.6 million in 2016 and $426.3 million thereafter.
As of December 31, 2011, the total intangible asset weighted average amortization period is approximately 20.5 years.
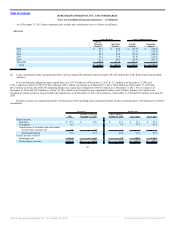
The change in the carrying amount of goodwill for the twelve months ended December 31, 2011 and the Successor period is as follows (in millions):
As of December 31,
2011 2010
Beginning balance $ 666.5 $ 680.8
Write off from refranchisings (2.3) (0.2)
Translation of foreign denominated balance (6.5) (14.1)
Ending balance $ 657.7 $ 666.5
89
Source: Burger King Holdings Inc, 10-K, March 14, 2012 Powered by Morningstar® Document Research℠