Burger King 2011 Annual Report Download - page 97
Download and view the complete annual report
Please find page 97 of the 2011 Burger King annual report below. You can navigate through the pages in the report by either clicking on the pages listed below, or by using the keyword search tool below to find specific information within the annual report.-
 1
1 -
2
-
3
-
4
-
5
-
6
-
7
-
8
-
9
-
10
-
11
-
12
-
13
-
14
-
15
-
16
-
17
-
18
-
19
-
20
-
21
-
22
-
23
-
24
-
25
-
26
-
27
-
28
-
29
-
30
-
31
-
32
-
33
-
34
-
35
-
36
-
37
-
38
-
39
-
40
-
41
-
42
-
43
-
44
-
45
-
46
-
47
-
48
-
49
-
50
-
51
-
52
-
53
-
54
-
55
-
56
-
57
-
58
-
59
-
60
-
61
-
62
-
63
-
64
-
65
-
66
-
67
-
68
-
69
-
70
-
71
-
72
-
73
-
74
-
75
-
76
-
77
-
78
-
79
-
80
-
81
-
82
-
83
-
84
-
85
-
86
-
 87
87 -
 88
88 -
 89
89 -
 90
90 -
 91
91 -
 92
92 -
 93
93 -
 94
94 -
 95
95 -
 96
96 -
 97
97 -
 98
98 -
 99
99 -
 100
100 -
 101
101 -
 102
102 -
 103
103 -
 104
104 -
 105
105 -
 106
106 -
 107
107 -
108
-
109
-
110
-
111
-
112
-
113
-
114
-
115
-
116
-
117
-
118
-
119
-
120
-
121
-
122
-
123
-
124
-
125
-
126
-
127
-
128
-
129
-
130
-
131
-
132
-
133
-
134
-
135
-
136
-
137
-
138
-
139
-
140
-
141
-
142
-
143
-
144
-
145
-
146
-
147
-
148
-
149
-
150
-
151
-
152
 |
 |
Table of Contents
BURGER KING HOLDINGS, INC. AND SUBSIDIARIES
Notes to Consolidated Financial Statements — (Continued)
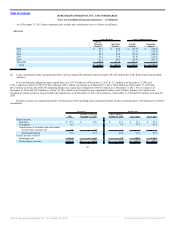
Interest Expense, net
Interest expense, net consists of the following (in millions):
Successor Predecessor
2011
October 19,
2010 to
December 31,
2010
July 1, 2010 to
October 18,
2010
Fiscal 2010 Fiscal 2009
Secured Term Loan — USD tranche $ 75.4 $ 19.1 $ — $ — $ —
Secured Term Loan — Euro tranche 14.3 4.3
Interest Rate Caps — USD and EURO 1.2 0.4 — — —
9 7/8 % Senior Notes 78.8 16.0 — — —
Amortization on original debt issuance discount,
deferred financing costs and other(1) 17.6 17.2 — — —
Predecessor term loans — — 12.0 39.4 47.2
Capital lease obligations 9.1 1.3 2.9 10.2 10.1
Interest income (1.6) (0.2) (0.3) (1.0) (2.7)
Total $ 194.8 $ 58.1 $ 14.6 $ 48.6 $ 54.6
(1) Amount includes commitment fees of $13.5 million associated with the bridge loan available at the closing of the Transactions for the period October 19,
2010 to December 31, 2010.
We had unamortized deferred financing costs of $49.6 million at December 31, 2011, $67.2 million at December 31, 2010 and $2.9 million at June 30,
2010. These amounts are classified as other assets, net and are amortized over the term of the debt into interest expense using the effective interest method. The
amortization of deferred financing costs included in interest expense for 2011 was $11.7 million, $2.1 million for the period October 19, 2010 to December 31,
2010, $0.6 million for the period July 1, 2010 to October 18, 2010, $2.1 million for Fiscal 2010 and $1.9 million for Fiscal 2009.
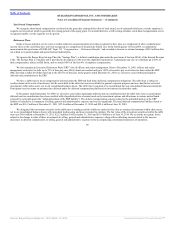
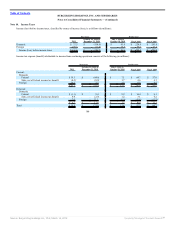
Note 9. Leases
As of December 31, 2011, we leased or subleased 1,081 restaurant properties to franchisees and 53 non-restaurant properties to third parties under capital
and operating leases. The building and leasehold improvements of the leases with franchisees are usually accounted for as direct financing leases and recorded as
a net investment in property leased to franchisees, while the land is classified as operating leases. Most leases to franchisees provide for fixed payments with
contingent rent when sales exceed certain levels. Lease terms generally range from 10 to 20 years. The franchisees bear the cost of maintenance, insurance and
property taxes.
96
Source: Burger King Holdings Inc, 10-K, March 14, 2012 Powered by Morningstar® Document Research℠