Burger King 2011 Annual Report Download - page 39
Download and view the complete annual report
Please find page 39 of the 2011 Burger King annual report below. You can navigate through the pages in the report by either clicking on the pages listed below, or by using the keyword search tool below to find specific information within the annual report.-
 1
1 -
2
-
3
-
4
-
5
-
6
-
7
-
8
-
9
-
10
-
11
-
12
-
13
-
14
-
15
-
16
-
17
-
18
-
19
-
20
-
21
-
22
-
23
-
24
-
25
-
26
-
27
-
28
-
 29
29 -
 30
30 -
 31
31 -
 32
32 -
 33
33 -
 34
34 -
 35
35 -
 36
36 -
 37
37 -
 38
38 -
 39
39 -
 40
40 -
 41
41 -
 42
42 -
 43
43 -
 44
44 -
 45
45 -
 46
46 -
 47
47 -
 48
48 -
 49
49 -
50
-
51
-
52
-
53
-
54
-
55
-
56
-
57
-
58
-
59
-
60
-
61
-
62
-
63
-
64
-
65
-
66
-
67
-
68
-
69
-
70
-
71
-
72
-
73
-
74
-
75
-
76
-
77
-
78
-
79
-
80
-
81
-
82
-
83
-
84
-
85
-
86
-
87
-
88
-
89
-
90
-
91
-
92
-
93
-
94
-
95
-
96
-
97
-
98
-
99
-
100
-
101
-
102
-
103
-
104
-
105
-
106
-
107
-
108
-
109
-
110
-
111
-
112
-
113
-
114
-
115
-
116
-
117
-
118
-
119
-
120
-
121
-
122
-
123
-
124
-
125
-
126
-
127
-
128
-
129
-
130
-
131
-
132
-
133
-
134
-
135
-
136
-
137
-
138
-
139
-
140
-
141
-
142
-
143
-
144
-
145
-
146
-
147
-
148
-
149
-
150
-
151
-
152
 |
 |

Table of Contents
in renewal franchise fees due to the timing of renewals as a result of incentives provided to franchisees to accelerate restaurant remodels in the U.S and the
impact of negative franchise comparable sales growth on royalties and contingent rents.
Franchise and property expenses increased primarily due to new leases and subleases associated with additional restaurants leased or subleased to
franchisees as a result of the refranchising of Company restaurants, the impact of acquisition accounting, including a $15.7 million increase in franchise
agreement amortization to $21.8 million, and unfavorable FX impact. These factors were partially offset by a decrease in bad debt expense.
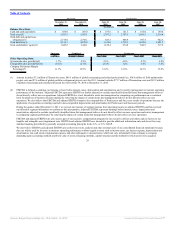
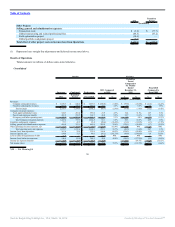
Selling, general and administrative expenses
Our selling, general and administrative expenses were comprised of the following:
Successor Combined Variance
2011 2010 $ %
Selling expenses $ 78.2 $ 86.2 $ (8.0) (9.3)%
Management general and administrative expenses 248.5 355.7 (107.2) (30.1)%
Share-based compensation and non-cash incentive compensation expense 6.4 14.1 (7.7) (54.6)%
Depreciation and amortization 15.9 18.0 (2.1) (11.7)%
Transaction costs 3.2 77.7 (74.5) (95.9)%
Global restructuring and related professional fees 46.5 67.2 (20.7) (30.8)%
Field optimization project costs 10.6 — 10.6 NM
Global portfolio realignment project 7.6 — 7.6 NM
Total general and administrative expenses 338.7 532.7 (194.0) (36.4)%
Selling, general and administrative expenses $ 416.9 $ 618.9 $(202.0) (32.6)%
NM — Not Meaningful
Selling expenses consist primarily of Company restaurant advertising fund contributions. Selling expenses as a percentage of Company restaurant revenues
were flat in comparison to the prior year.
Management general and administrative expenses (“Management G&A”) are comprised primarily of salary and employee related costs for our
non-restaurant employees, professional fees and general overhead for our corporate offices, including rent, maintenance and utilities, travel and meeting
expenses, IT and technology costs and other general operating expenses. General and administrative expenses also include certain non-cash expenses, including
shared-based compensation and the portion of annual non-cash incentive compensation that eligible employees elected to receive as common equity, depreciation
and amortization as well as separately managed expenses associated with unusual or non-recurring events, such as costs associated with our global portfolio
realignment project. The decrease in Management G&A in 2011 was driven by a decrease in salary and fringe benefits and a decrease in professional fees, which
are directly attributable to the benefits derived from our global restructuring and implementation of a Zero Based Budgeting (“ZBB”) program.
The decrease in our total general and administrative expenses was driven by the decreases in Management G&A, Transaction costs, global restructuring
and related professional fees and share-based compensation, as well as a decrease in depreciation and amortization resulting from acquisition accounting. These
factors were partially offset by costs incurred in connection with our global portfolio realignment project and field optimization project.
38
Source: Burger King Holdings Inc, 10-K, March 14, 2012 Powered by Morningstar® Document Research℠