Burger King 2011 Annual Report Download - page 48
Download and view the complete annual report
Please find page 48 of the 2011 Burger King annual report below. You can navigate through the pages in the report by either clicking on the pages listed below, or by using the keyword search tool below to find specific information within the annual report.-
 1
1 -
2
-
3
-
4
-
5
-
6
-
7
-
8
-
9
-
10
-
11
-
12
-
13
-
14
-
15
-
16
-
17
-
18
-
19
-
20
-
21
-
22
-
23
-
24
-
25
-
26
-
27
-
28
-
29
-
30
-
31
-
32
-
33
-
34
-
35
-
36
-
37
-
 38
38 -
 39
39 -
 40
40 -
 41
41 -
 42
42 -
 43
43 -
 44
44 -
 45
45 -
 46
46 -
 47
47 -
 48
48 -
 49
49 -
 50
50 -
 51
51 -
 52
52 -
 53
53 -
 54
54 -
 55
55 -
 56
56 -
 57
57 -
 58
58 -
59
-
60
-
61
-
62
-
63
-
64
-
65
-
66
-
67
-
68
-
69
-
70
-
71
-
72
-
73
-
74
-
75
-
76
-
77
-
78
-
79
-
80
-
81
-
82
-
83
-
84
-
85
-
86
-
87
-
88
-
89
-
90
-
91
-
92
-
93
-
94
-
95
-
96
-
97
-
98
-
99
-
100
-
101
-
102
-
103
-
104
-
105
-
106
-
107
-
108
-
109
-
110
-
111
-
112
-
113
-
114
-
115
-
116
-
117
-
118
-
119
-
120
-
121
-
122
-
123
-
124
-
125
-
126
-
127
-
128
-
129
-
130
-
131
-
132
-
133
-
134
-
135
-
136
-
137
-
138
-
139
-
140
-
141
-
142
-
143
-
144
-
145
-
146
-
147
-
148
-
149
-
150
-
151
-
152
 |
 |

Table of Contents
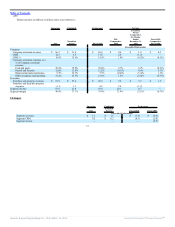
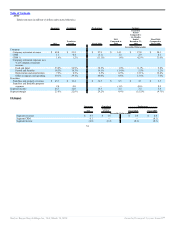
Transition Period compared to the Six Months Ended December 31, 2009
Company restaurants
Company restaurant revenues decreased due to the net refranchising of 44 Company restaurants and the effects of negative Company comparable sales
growth. These factors were partially offset by favorable FX impact in Canada.
CRM % decreased primarily due to the impact of sales deleverage on our fixed labor and occupancy and other operating costs, the impact of acquisition
accounting, higher commodity prices in the U.S. and an increase in the hourly wage rate in Canada. These factors were partially offset by the successful launch
of higher priced premium products and discontinued value promotions, such as the 1/4 lb. Double Cheeseburger. Additional offsets include benefits realized from
improvements in variable labor controls and scheduling in our U.S. restaurants and a favorable adjustment to the self insurance reserve as a result of favorable
developments in our claim trends and to adjust our incurred but not reported confidence level.
Franchise and Property
Franchise and property revenues decreased due to the impact of negative franchise comparable sales growth on royalties and contingent rents and a
reduction in initial and renewal franchise fees. These factors were partially offset by acquisition accounting.
Franchise and property expenses increased primarily as a result of additional restaurants leased or subleased to franchisees due to the net refranchising of
Company restaurants, the impact of acquisition accounting, including a $1.1 million increase in franchise agreement amortization to $3.9 million, and an increase
in bad debt expense.
FX impact was not significant to franchise and property revenues/expenses.
Segment income and segment margin
Segment income and margin increased due to a decrease in Management G&A partially offset by a decrease in Company restaurant margin and net
franchise and property income.
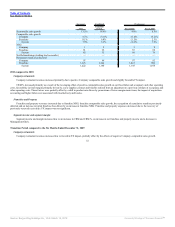
Fiscal 2010 compared to Fiscal 2009
Company restaurants
Company restaurant revenues decreased due to the net refranchising of 51 Company restaurants and the effects of negative Company comparable sales
growth. These factors were partially offset by favorable FX impact in Canada.
CRM % increased primarily due to decreases in commodity costs, strategic pricing initiatives, improvements in variable labor controls and favorable
adjustments to our self-insurance reserve. These factors were partially offset by the unfavorable impact of sales deleverage on our fixed labor and occupancy
costs as a result of negative Company comparable sales growth and additional depreciation expense associated with strategic initiatives.
Franchise and Property
Franchise and property revenues decreased due to negative franchise comparable sales growth and a reduction in renewal franchise fees due to fewer
franchise agreement expirations and temporary extensions of expired franchise agreements in the U.S. These factors were partially offset by the net refranchising
of Company restaurants and an increase in the effective royalty rate in the U.S. FX impact was not significant in the segment.
47
Source: Burger King Holdings Inc, 10-K, March 14, 2012 Powered by Morningstar® Document Research℠