Burger King 2011 Annual Report Download - page 57
Download and view the complete annual report
Please find page 57 of the 2011 Burger King annual report below. You can navigate through the pages in the report by either clicking on the pages listed below, or by using the keyword search tool below to find specific information within the annual report.-
 1
1 -
2
-
3
-
4
-
5
-
6
-
7
-
8
-
9
-
10
-
11
-
12
-
13
-
14
-
15
-
16
-
17
-
18
-
19
-
20
-
21
-
22
-
23
-
24
-
25
-
26
-
27
-
28
-
29
-
30
-
31
-
32
-
33
-
34
-
35
-
36
-
37
-
38
-
39
-
40
-
41
-
42
-
43
-
44
-
45
-
46
-
 47
47 -
 48
48 -
 49
49 -
 50
50 -
 51
51 -
 52
52 -
 53
53 -
 54
54 -
 55
55 -
 56
56 -
 57
57 -
 58
58 -
 59
59 -
 60
60 -
 61
61 -
 62
62 -
 63
63 -
 64
64 -
 65
65 -
 66
66 -
 67
67 -
68
-
69
-
70
-
71
-
72
-
73
-
74
-
75
-
76
-
77
-
78
-
79
-
80
-
81
-
82
-
83
-
84
-
85
-
86
-
87
-
88
-
89
-
90
-
91
-
92
-
93
-
94
-
95
-
96
-
97
-
98
-
99
-
100
-
101
-
102
-
103
-
104
-
105
-
106
-
107
-
108
-
109
-
110
-
111
-
112
-
113
-
114
-
115
-
116
-
117
-
118
-
119
-
120
-
121
-
122
-
123
-
124
-
125
-
126
-
127
-
128
-
129
-
130
-
131
-
132
-
133
-
134
-
135
-
136
-
137
-
138
-
139
-
140
-
141
-
142
-
143
-
144
-
145
-
146
-
147
-
148
-
149
-
150
-
151
-
152
 |
 |

Table of Contents
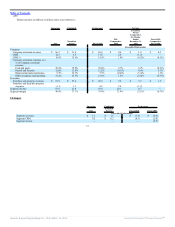
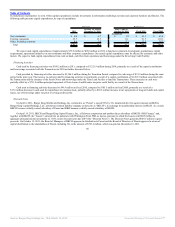
Franchise and Property
Franchise and property revenues increased due to royalties derived from franchise NRG and franchise comparable sales growth. Franchise and property
expenses increased due to the impact of acquisition accounting, including a $0.5 million increase in franchise agreement amortization to $0.7 million. FX impact
was not significant.
Segment income and segment margin
Segment income increased primarily due to an increase in CRM and net franchise and property income, partially offset by an increase in Management
G&A, while segment margin decreased primarily due to an increase in Management G&A as a result of increases in salary and fringe benefits from increased
headcount.
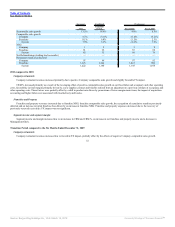
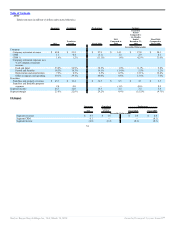
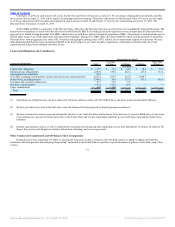
Fiscal 2010 compared to Fiscal 2009
Company restaurants
Company restaurant revenues increased due to Company NRG, the acquisition of franchise restaurants in Singapore in March 2010, Company comparable
sales growth and favorable FX impact.
CRM % improved primarily due to the favorable impact of sales leverage on our fixed labor and occupancy costs as a result of an increase in Company
restaurant revenues and Company comparable sales growth.
Franchise and Property
Franchise and property revenues increased due to franchise comparable sales growth and royalties derived from franchise NRG.
Franchise and property expenses increased as a result of the amortization of reacquired franchise rights related to the 35 refranchised restaurants in
Singapore discussed above.
Segment income and segment margin
Segment income primarily increased due to an increase in net franchise and property income partially offset by an increase in selling expenses.
Liquidity and Capital Resources
At December 31, 2011, we had cash and cash equivalents of $458.8 million and working capital of $251.2 million. In addition, at December 31, 2011, we
had borrowing capacity of $135.5 million under our Revolving Credit Facility. Cash provided by operations was $406.2 million in 2011 compared to cash
provided by operations of $183.1 million in 2010.
Our primary sources of liquidity are cash generated by operations and borrowings available under our Revolving Credit Facility. We have used, and may
in the future use, our liquidity to make required interest and principal payments, to voluntarily repay and/or repurchase, our or one of our affiliate’s outstanding
debt, to fund our capital expenditures and/or to pay dividends to our parent holding company. Based on our current level of operations and available cash, we
believe our cash flow from operations, combined with availability under our Revolving Credit Facility, will provide sufficient liquidity to fund our current
obligations, debt service requirements and capital spending requirements over the next twelve months and the foreseeable future.
Our consolidated cash and cash equivalents include balances held in foreign tax jurisdictions that represent undistributed earnings of our foreign
subsidiaries, which are considered indefinitely reinvested for U.S. income tax purposes. We do not plan to utilize cash flows from our foreign subsidiaries to
meet our future debt service
56
Source: Burger King Holdings Inc, 10-K, March 14, 2012 Powered by Morningstar® Document Research℠