Burger King 2011 Annual Report Download - page 126
Download and view the complete annual report
Please find page 126 of the 2011 Burger King annual report below. You can navigate through the pages in the report by either clicking on the pages listed below, or by using the keyword search tool below to find specific information within the annual report.-
 1
1 -
2
-
3
-
4
-
5
-
6
-
7
-
8
-
9
-
10
-
11
-
12
-
13
-
14
-
15
-
16
-
17
-
18
-
19
-
20
-
21
-
22
-
23
-
24
-
25
-
26
-
27
-
28
-
29
-
30
-
31
-
32
-
33
-
34
-
35
-
36
-
37
-
38
-
39
-
40
-
41
-
42
-
43
-
44
-
45
-
46
-
47
-
48
-
49
-
50
-
51
-
52
-
53
-
54
-
55
-
56
-
57
-
58
-
59
-
60
-
61
-
62
-
63
-
64
-
65
-
66
-
67
-
68
-
69
-
70
-
71
-
72
-
73
-
74
-
75
-
76
-
77
-
78
-
79
-
80
-
81
-
82
-
83
-
84
-
85
-
86
-
87
-
88
-
89
-
90
-
91
-
92
-
93
-
94
-
95
-
96
-
97
-
98
-
99
-
100
-
101
-
102
-
103
-
104
-
105
-
106
-
107
-
108
-
109
-
110
-
111
-
112
-
113
-
114
-
115
-
 116
116 -
 117
117 -
 118
118 -
 119
119 -
 120
120 -
 121
121 -
 122
122 -
 123
123 -
 124
124 -
 125
125 -
 126
126 -
 127
127 -
 128
128 -
 129
129 -
 130
130 -
 131
131 -
 132
132 -
 133
133 -
 134
134 -
 135
135 -
 136
136 -
137
-
138
-
139
-
140
-
141
-
142
-
143
-
144
-
145
-
146
-
147
-
148
-
149
-
150
-
151
-
152
 |
 |

Table of Contents
BURGER KING HOLDINGS, INC. AND SUBSIDIARIES
Notes to Consolidated Financial Statements — (Continued)
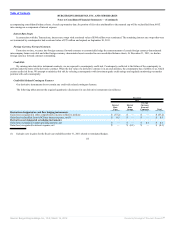
For Fiscal 2010 and 2009, the United States and Germany each represented 10% or more of our total revenues. For fiscal 2010 revenues in the United
States totaled $1.5 billion, and revenues in Germany totaled $281.9 million. For Fiscal 2009, revenues in the United States totaled $1.6 billion, and revenues in
Germany totaled $307.2 million.
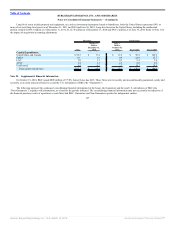
During the quarter ended December 31, 2011, we revised our measure of segment income from operating income to adjusted EBITDA and have revised
our historical segment information to conform to this presentation. Adjusted EBITDA represents earnings before interest, taxes, depreciation and amortization,
adjusted to exclude specifically identified items that management believes do not directly reflect our core operations and assists management in comparing
segment performance by removing the impact of certain items that management believes do not reflect our core operations.
Successor Predecessor
2011
October 19,
2010 to
December 31,
2010
July 1,
2010 to
October 18,
2010 Fiscal 2010 Fiscal 2009
Segment Income:
United States and Canada $ 449.5 $ 77.2 $ 145.0 $ 450.5 $ 442.7
EMEA 146.0 20.1 30.8 85.3 84.7
LAC 63.9 9.5 12.3 43.4 43.4
APAC 26.7 4.9 7.1 18.3 12.5
Total 686.1 111.7 195.2 597.5 583.3
Unallocated Management G&A (101.1) (16.5) (60.3) (136.6) (127.7)
Consolidated adjusted EBITDA 585.0 95.2 134.9 460.9 455.6
Share-based compensation and non-cash incentive
compensation expense 6.4 — 5.8 17.0 16.2
Depreciation and amortization 136.4 27.6 31.2 111.7 98.1
Transaction costs 3.2 77.7 — — —
Global restructuring and related professional fees 46.5 67.2 — — —
Field optimization project costs 10.6 — — — —
Global portfolio realignment project 7.6 — — — —
Other operating (income) expenses, net 11.3 (8.7) (3.6) (0.7) 1.9
Income (loss) from operations 363.0 (68.6) 101.5 332.9 339.4
Interest expense, net 194.8 58.1 14.6 48.6 54.6
Loss on early extinguishment of debt 21.4 — — — —
Income tax expense 39.8 (25.1) 15.8 97.5 84.7
Net income (loss) 107.0 (101.6) 71.1 186.8 200.1
125
Source: Burger King Holdings Inc, 10-K, March 14, 2012 Powered by Morningstar® Document Research℠