Burger King 2011 Annual Report Download - page 89
Download and view the complete annual report
Please find page 89 of the 2011 Burger King annual report below. You can navigate through the pages in the report by either clicking on the pages listed below, or by using the keyword search tool below to find specific information within the annual report.-
 1
1 -
2
-
3
-
4
-
5
-
6
-
7
-
8
-
9
-
10
-
11
-
12
-
13
-
14
-
15
-
16
-
17
-
18
-
19
-
20
-
21
-
22
-
23
-
24
-
25
-
26
-
27
-
28
-
29
-
30
-
31
-
32
-
33
-
34
-
35
-
36
-
37
-
38
-
39
-
40
-
41
-
42
-
43
-
44
-
45
-
46
-
47
-
48
-
49
-
50
-
51
-
52
-
53
-
54
-
55
-
56
-
57
-
58
-
59
-
60
-
61
-
62
-
63
-
64
-
65
-
66
-
67
-
68
-
69
-
70
-
71
-
72
-
73
-
74
-
75
-
76
-
77
-
78
-
 79
79 -
 80
80 -
 81
81 -
 82
82 -
 83
83 -
 84
84 -
 85
85 -
 86
86 -
 87
87 -
 88
88 -
 89
89 -
 90
90 -
 91
91 -
 92
92 -
 93
93 -
 94
94 -
 95
95 -
 96
96 -
 97
97 -
 98
98 -
 99
99 -
100
-
101
-
102
-
103
-
104
-
105
-
106
-
107
-
108
-
109
-
110
-
111
-
112
-
113
-
114
-
115
-
116
-
117
-
118
-
119
-
120
-
121
-
122
-
123
-
124
-
125
-
126
-
127
-
128
-
129
-
130
-
131
-
132
-
133
-
134
-
135
-
136
-
137
-
138
-
139
-
140
-
141
-
142
-
143
-
144
-
145
-
146
-
147
-
148
-
149
-
150
-
151
-
152
 |
 |

Table of Contents
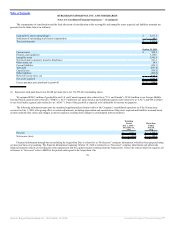
BURGER KING HOLDINGS, INC. AND SUBSIDIARIES
Notes to Consolidated Financial Statements — (Continued)
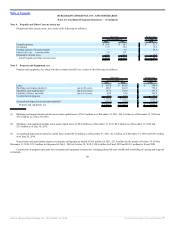
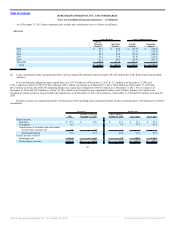
Note 4. Prepaids and Other Current Assets, net
Prepaid and other current assets, net consist of the following (in millions):
Successor Predecessor
As of December 31, As of June 30,
2011 2010 2010
Prepaid expenses $ 29.6 $ 38.7 $ 33.1
Inventories 13.7 15.6 15.4
Foreign currency forward contracts — 7.9 25.9
Interest rate cap — current portion 3.6 11.1 —
Refundable income taxes 21.1 99.2 14.0
Total Prepaids and other current assets $ 68.0 $ 172.5 $ 88.4
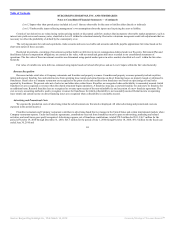
Note 5. Property and Equipment, net
Property and equipment, net, along with their estimated useful lives, consist of the following (in millions):
Successor Predecessor
As of December 31, As of June 30,
2011 2010 2010
Land $ 450.0 $ 461.4 $ 386.0
Buildings and improvements(1) (up to 40 years) 468.7 442.0 756.2
Machinery and equipment(2) (up to 18 years) 157.4 134.9 347.3
Furniture, fixtures, and other (up to 10 years) 40.9 34.6 149.0
Construction in progress 59.6 63.3 42.5
1,176.6 1,136.2 1,681.0
Accumulated depreciation and amortization(3) (150.1) (25.5) (666.9)
Property and equipment, net $ 1,026.5 $ 1,110.7 $ 1,014.1
(1) Buildings and improvements include assets under capital leases of $54.3 million as of December 31, 2011, $46.5 million as of December 31, 2010 and
$76.6 million as of June 30, 2010.
(2) Machinery and equipment include assets under capital leases of $0.2 million as of December 31, 2011, $0.2 million as of December 31, 2010 and
$1.9 million as of June 30, 2010.
(3) Accumulated depreciation related to capital leases totaled $14.2 million as of December 31, 2011, $2.2 million as of December 31, 2010 and $38.6 million
as of June 30, 2010.
Depreciation and amortization expense on property and equipment totaled $124.6 million for 2011, $25.5 million for the period of October 19, 2010 to
December 31, 2010, $33.2 million for the period of July 1, 2010 to October 18, 2010, $120.6 million for Fiscal 2010 and $110.1 million for Fiscal 2009.
Construction in progress represents new restaurant and equipment construction, reimaging (demolish and rebuild) and remodeling of existing and acquired
restaurants.
88
Source: Burger King Holdings Inc, 10-K, March 14, 2012 Powered by Morningstar® Document Research℠