Burger King 2011 Annual Report Download - page 77
Download and view the complete annual report
Please find page 77 of the 2011 Burger King annual report below. You can navigate through the pages in the report by either clicking on the pages listed below, or by using the keyword search tool below to find specific information within the annual report.-
 1
1 -
2
-
3
-
4
-
5
-
6
-
7
-
8
-
9
-
10
-
11
-
12
-
13
-
14
-
15
-
16
-
17
-
18
-
19
-
20
-
21
-
22
-
23
-
24
-
25
-
26
-
27
-
28
-
29
-
30
-
31
-
32
-
33
-
34
-
35
-
36
-
37
-
38
-
39
-
40
-
41
-
42
-
43
-
44
-
45
-
46
-
47
-
48
-
49
-
50
-
51
-
52
-
53
-
54
-
55
-
56
-
57
-
58
-
59
-
60
-
61
-
62
-
63
-
64
-
65
-
66
-
 67
67 -
 68
68 -
 69
69 -
 70
70 -
 71
71 -
 72
72 -
 73
73 -
 74
74 -
 75
75 -
 76
76 -
 77
77 -
 78
78 -
 79
79 -
 80
80 -
 81
81 -
 82
82 -
 83
83 -
 84
84 -
 85
85 -
 86
86 -
 87
87 -
88
-
89
-
90
-
91
-
92
-
93
-
94
-
95
-
96
-
97
-
98
-
99
-
100
-
101
-
102
-
103
-
104
-
105
-
106
-
107
-
108
-
109
-
110
-
111
-
112
-
113
-
114
-
115
-
116
-
117
-
118
-
119
-
120
-
121
-
122
-
123
-
124
-
125
-
126
-
127
-
128
-
129
-
130
-
131
-
132
-
133
-
134
-
135
-
136
-
137
-
138
-
139
-
140
-
141
-
142
-
143
-
144
-
145
-
146
-
147
-
148
-
149
-
150
-
151
-
152
 |
 |

Table of Contents
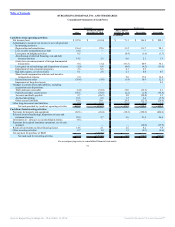
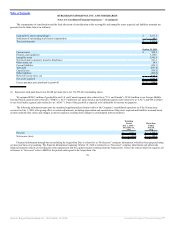
BURGER KING HOLDINGS, INC. AND SUBSIDIARIES
Consolidated Statements of Cash Flows — (Continued)
Successor Predecessor
2011
October 19, 2010 to
December 31, 2010
July 1, 2010 to
October 18, 2010 Fiscal 2010 Fiscal 2009
(In millions)
Cash flows from financing activities:
Proceeds from term debt 1,860.0 1,837.1 — — —
Proceeds from Senior Notes — 800.0 — — —
Repayments of term debt and capital leases (1,874.5) (3.2) (23.5) (67.7) (7.4)
Extinguishment of debt (63.0) (731.8) — — —
Borrowings under revolving credit facility — — — 38.5 94.3
Repayments of revolving credit facility — — — (38.5) (144.3)
Payment of financing costs (23.1) (69.2) — — —
Dividends paid on common stock — — (8.6) (34.2) (34.1)
Proceeds from stock option exercises — — 4.0 4.2 3.0
Repurchases of common stock — — (2.5) (2.7) (20.3)
Excess tax benefits from stock-based compensation — — 1.1 3.5 3.3
Dividend to Parent (7.6) — — — —
Capital contribution from 3G — 1,563.5 — — —
Net cash provided by (used for) financing
activities (108.2) 3,396.4 (29.5) (96.9) (105.5)
Effect of exchange rates on cash and cash equivalents (4.8) (4.7) 11.8 (12.7) (7.6)
Increase (decrease) in cash and cash equivalents 251.8 (79.4) 98.8 65.9 (44.3)
Cash and cash equivalents at beginning of period 207.0 286.4 187.6 121.7 166.0
Cash and cash equivalents at end of period $ 458.8 $ 207.0 $ 286.4 $ 187.6 $ 121.7
Supplemental cashflow disclosures:
Interest paid $ 183.0 $ 28.0 $ 13.7 $ 48.7 $ 56.0
Income taxes paid $ 26.2 $ 4.5 $ 24.4 $ 54.3 $ 112.3
Non-cash investing and financing activities:
Acquisition of property with capital lease obligations $ 3.2 $ — $ — $ 3.7 $ 2.2
Net investment in direct financing leases $ 14.6 $ 1.3 $ 4.4 $ 11.0 $ 12.2
Deferred premium on interest rate caps $ — $ 56.1 $ — $ — $ —
See accompanying notes to consolidated financial statements.
76
Source: Burger King Holdings Inc, 10-K, March 14, 2012 Powered by Morningstar® Document Research℠