Burger King 2011 Annual Report Download - page 44
Download and view the complete annual report
Please find page 44 of the 2011 Burger King annual report below. You can navigate through the pages in the report by either clicking on the pages listed below, or by using the keyword search tool below to find specific information within the annual report.-
 1
1 -
2
-
3
-
4
-
5
-
6
-
7
-
8
-
9
-
10
-
11
-
12
-
13
-
14
-
15
-
16
-
17
-
18
-
19
-
20
-
21
-
22
-
23
-
24
-
25
-
26
-
27
-
28
-
29
-
30
-
31
-
32
-
33
-
 34
34 -
 35
35 -
 36
36 -
 37
37 -
 38
38 -
 39
39 -
 40
40 -
 41
41 -
 42
42 -
 43
43 -
 44
44 -
 45
45 -
 46
46 -
 47
47 -
 48
48 -
 49
49 -
 50
50 -
 51
51 -
 52
52 -
 53
53 -
 54
54 -
55
-
56
-
57
-
58
-
59
-
60
-
61
-
62
-
63
-
64
-
65
-
66
-
67
-
68
-
69
-
70
-
71
-
72
-
73
-
74
-
75
-
76
-
77
-
78
-
79
-
80
-
81
-
82
-
83
-
84
-
85
-
86
-
87
-
88
-
89
-
90
-
91
-
92
-
93
-
94
-
95
-
96
-
97
-
98
-
99
-
100
-
101
-
102
-
103
-
104
-
105
-
106
-
107
-
108
-
109
-
110
-
111
-
112
-
113
-
114
-
115
-
116
-
117
-
118
-
119
-
120
-
121
-
122
-
123
-
124
-
125
-
126
-
127
-
128
-
129
-
130
-
131
-
132
-
133
-
134
-
135
-
136
-
137
-
138
-
139
-
140
-
141
-
142
-
143
-
144
-
145
-
146
-
147
-
148
-
149
-
150
-
151
-
152
 |
 |

Table of Contents
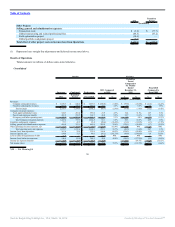
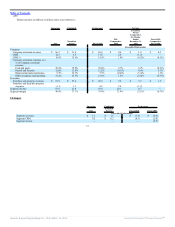
Profitability Measures and Non-GAAP Reconciliations
Tabular amounts in millions of dollars unless noted otherwise.
Results Variance
Successor Combined Predecessor
2011 Compared
to 2010
Transition
Period
Compared to
Six Months
Ended
December 31,
2009
Fiscal 2010
Compared to
Fiscal 2009
2011
Transition
Period Fiscal 2010 $ % $ % $ %
Favorable / (Unfavorable)
Segment income:
U.S. and Canada $ 449.5 $ 222.2 $ 450.5 $ 7.0 1.6% $ (8.7) (3.8)% $ 7.8 1.8%
EMEA 146.0 50.9 85.3 58.5 66.9% 2.6 5.4% 0.6 0.7%
Latin America 63.9 21.8 43.4 20.1 45.9% 0.7 3.3% — 0.0%
APAC 26.7 12.0 18.3 5.2 24.2% 3.2 36.4% 5.8 46.4%
Total 686.1 306.9 597.5 90.8 15.3% (2.2) (0.7)% 14.2 2.4%
Unallocated Management G&A (101.1) (76.8) (136.6) 40.6 (28.7)% (5.1) 7.1% (8.9) 7.0%
Adjusted EBITDA 585.0 230.1 460.9 131.4 29.0% (7.3) (3.1)% 5.3 1.2%
Share-based compensation and non-cash incentive
compensation expense 6.4 5.8 17.0 7.7 54.6% 2.9 33.3% (0.8) (4.9)%
Depreciation and amortization 136.4 58.8 111.7 (18.3) (15.5)% (6.4) (12.2)% (13.6) (13.9)%
Transaction costs 3.2 77.7 — 74.5 95.9% (77.7) NM — NM
Global restructuring and related professional fees 46.5 67.2 — 20.7 30.8% (67.2) NM — NM
Field optimization project costs 10.6 — — (10.6) NM — NM — NM
Global portfolio realignment project 7.6 — — (7.6) NM — NM — NM
Other operating (income) expenses, net 11.3 (12.3) (0.7) (29.4) NM 17.4 NM 2.6 NM
Income (loss) from operations 363.0 32.9 332.9 168.4 86.5% (138.3) (80.8)% (6.5) (1.9)%
Interest expense, net 194.8 72.7 48.6 (98.2) (101.7)% (48.0) (194.3)% 6.0 11.0%
Loss on early extinguishment of debt 21.4 — — (21.4) NM — NM — NM
Income tax expense (benefit) 39.8 (9.3) 97.5 (1.4) (3.6)% 59.0 118.7% (12.8) (15.1)%
Net income $ 107.0 $ (30.5) $ 186.8 $ 47.4 79.5% $ (127.3) (131.5)% $ (13.3) (6.6)%
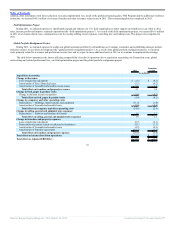
During the quarter ended December 31, 2011, we revised our measure of segment income from operating income to adjusted EBITDA and have revised
our historical segment information to conform to this presentation. Adjusted EBITDA represents earnings before interest, taxes, depreciation and amortization,
adjusted to exclude specifically identified items that management believes do not directly reflect our core operations and assists management in comparing
segment performance by removing the impact of certain items that management believes do not reflect our core operations (See Note 19 to our audited
Consolidated Financial Statements included in Item 8, “Financial Statements and Supplementary Data”).
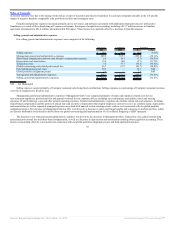
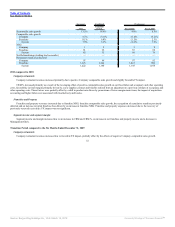
2011 compared to 2010
The increase in adjusted EBITDA in 2011 was driven primarily by reductions in Unallocated Management G&A and increases in segment income in each
of our four operating segments. Unallocated Management G&A represents corporate support costs in areas such as facilities, finance, human resources,
information technology, legal, marketing and supply chain management, which benefit all of our geographic segments and system-wide restaurants and are not
allocated specifically to any of the geographic segments.
The increase in income from operations in 2011 was driven by the increase in consolidated adjusted EBITDA and reductions in share-based compensation
expense, Transaction costs and global restructuring and related professional fees. These factors were partially offset by an increase in depreciation and
amortization, primarily as a result of acquisition accounting, as well as field optimization project costs, global portfolio realignment project costs and a decrease
in other income, net.
43
Source: Burger King Holdings Inc, 10-K, March 14, 2012 Powered by Morningstar® Document Research℠