Burger King 2011 Annual Report Download - page 34
Download and view the complete annual report
Please find page 34 of the 2011 Burger King annual report below. You can navigate through the pages in the report by either clicking on the pages listed below, or by using the keyword search tool below to find specific information within the annual report.-
 1
1 -
2
-
3
-
4
-
5
-
6
-
7
-
8
-
9
-
10
-
11
-
12
-
13
-
14
-
15
-
16
-
17
-
18
-
19
-
20
-
21
-
22
-
23
-
 24
24 -
 25
25 -
 26
26 -
 27
27 -
 28
28 -
 29
29 -
 30
30 -
 31
31 -
 32
32 -
 33
33 -
 34
34 -
 35
35 -
 36
36 -
 37
37 -
 38
38 -
 39
39 -
 40
40 -
 41
41 -
 42
42 -
 43
43 -
 44
44 -
45
-
46
-
47
-
48
-
49
-
50
-
51
-
52
-
53
-
54
-
55
-
56
-
57
-
58
-
59
-
60
-
61
-
62
-
63
-
64
-
65
-
66
-
67
-
68
-
69
-
70
-
71
-
72
-
73
-
74
-
75
-
76
-
77
-
78
-
79
-
80
-
81
-
82
-
83
-
84
-
85
-
86
-
87
-
88
-
89
-
90
-
91
-
92
-
93
-
94
-
95
-
96
-
97
-
98
-
99
-
100
-
101
-
102
-
103
-
104
-
105
-
106
-
107
-
108
-
109
-
110
-
111
-
112
-
113
-
114
-
115
-
116
-
117
-
118
-
119
-
120
-
121
-
122
-
123
-
124
-
125
-
126
-
127
-
128
-
129
-
130
-
131
-
132
-
133
-
134
-
135
-
136
-
137
-
138
-
139
-
140
-
141
-
142
-
143
-
144
-
145
-
146
-
147
-
148
-
149
-
150
-
151
-
152
 |
 |

Table of Contents
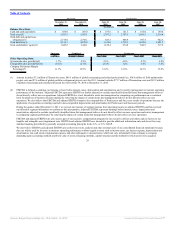
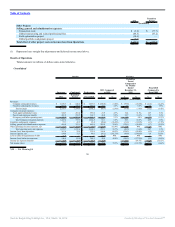
Franchise sales represent sales at all franchise restaurants and are revenues to our franchisees. We do not record franchise sales as revenues; however, our
franchise revenues include royalties based on franchise sales. System-wide results are driven primarily by our franchise restaurants, as approximately 90% of
our current system-wide restaurants are franchised.
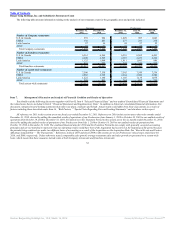
Overview
We operate in the fast food hamburger restaurant, or FFHR, category of the quick service restaurant, or QSR, segment of the restaurant industry. We are
the second largest FFHR chain in the world as measured by number of restaurants and system-wide sales. Our system of restaurants includes restaurants owned
by us, as well as our franchisees. Our business is comprised of four operating segments: (1) the U.S. and Canada; (2) Europe, the Middle East and Africa, or
EMEA; (3) Latin America and the Caribbean, or LAC; and (4) Asia Pacific, or APAC.
As of December 31, 2011, there were 12,512 Burger King restaurants system-wide. We operate 939 restaurants in the U.S. and Canada and 356 restaurants
in EMEA, LAC and APAC, and our franchisees operate 6,561 restaurants in the U.S. and Canada and 4,656 restaurants in EMEA, LAC and APAC.
Approximately 90% of our current restaurants are franchised and we have a higher percentage of franchise restaurants to Company restaurants than our major
competitors in the FFHR category. We believe that our high percentage of franchise restaurants provides us with a strategic advantage because the capital
required to grow and maintain our system is funded primarily by franchisees. In addition, our franchisees fund the majority of the advertising that supports the
Brand by making advertising contributions. Our franchise dominated business model does, however, present a number of drawbacks and risks, such as our
limited control over franchisees and limited ability to facilitate changes in restaurant ownership. In addition, our operating results are closely tied to the success
of our franchisees, and we are dependent on franchisees to open new restaurants as part of our growth strategy.
In 2011, sales at Company restaurants comprised 70% of our revenues, with our remaining revenue comprised of revenues we derive from our franchise
system, consisting primarily of royalties and franchise fees as well as property income we derive from properties we lease or sublease to our franchisees. We
expect the current mix of Company and franchise revenue to shift towards franchise revenue as we continue to implement our global portfolio realignment.
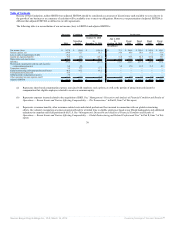
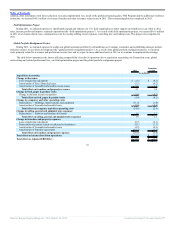
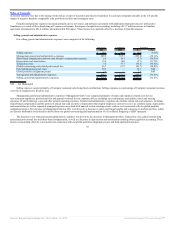
We evaluate our restaurants and assess our business based on the following operating metrics and key financial measures:
• Sales growth refers to the change in sales at all Company and franchise restaurants in one period from the same period in the prior year. We review
sales growth as an operating metric to help identify and assess trends in restaurant sales for the Burger King system as a whole, without distortion
from the effects of refranchised or acquired restaurants.
• Comparable sales growth refers to the change in restaurant sales in one period from the same prior year period for restaurants that have been opened
for thirteen months or longer.
• Average restaurant sales refer to the total sales averaged over total store months for all Company and franchise restaurants open during that period.
• Net restaurant growth (“NRG”) represents the opening of new restaurants during a stated period, net of closures.
• Net refranchisings refer to sales of Company restaurants to franchisees, net of acquisitions of franchise restaurants by us.
• Company restaurant margin, or CRM, is derived by subtracting Company restaurant expenses from Company restaurant revenues for a stated period,
and is typically analyzed as a percentage of Company restaurant revenues, a metric we refer to as Company restaurant margin %, or CRM %.
Company
33
Source: Burger King Holdings Inc, 10-K, March 14, 2012 Powered by Morningstar® Document Research℠