Burger King 2011 Annual Report Download - page 143
Download and view the complete annual report
Please find page 143 of the 2011 Burger King annual report below. You can navigate through the pages in the report by either clicking on the pages listed below, or by using the keyword search tool below to find specific information within the annual report.-
 1
1 -
2
-
3
-
4
-
5
-
6
-
7
-
8
-
9
-
10
-
11
-
12
-
13
-
14
-
15
-
16
-
17
-
18
-
19
-
20
-
21
-
22
-
23
-
24
-
25
-
26
-
27
-
28
-
29
-
30
-
31
-
32
-
33
-
34
-
35
-
36
-
37
-
38
-
39
-
40
-
41
-
42
-
43
-
44
-
45
-
46
-
47
-
48
-
49
-
50
-
51
-
52
-
53
-
54
-
55
-
56
-
57
-
58
-
59
-
60
-
61
-
62
-
63
-
64
-
65
-
66
-
67
-
68
-
69
-
70
-
71
-
72
-
73
-
74
-
75
-
76
-
77
-
78
-
79
-
80
-
81
-
82
-
83
-
84
-
85
-
86
-
87
-
88
-
89
-
90
-
91
-
92
-
93
-
94
-
95
-
96
-
97
-
98
-
99
-
100
-
101
-
102
-
103
-
104
-
105
-
106
-
107
-
108
-
109
-
110
-
111
-
112
-
113
-
114
-
115
-
116
-
117
-
118
-
119
-
120
-
121
-
122
-
123
-
124
-
125
-
126
-
127
-
128
-
129
-
130
-
131
-
132
-
 133
133 -
 134
134 -
 135
135 -
 136
136 -
 137
137 -
 138
138 -
 139
139 -
 140
140 -
 141
141 -
 142
142 -
 143
143 -
 144
144 -
 145
145 -
 146
146 -
 147
147 -
 148
148 -
 149
149 -
 150
150 -
 151
151 -
 152
152
 |
 |

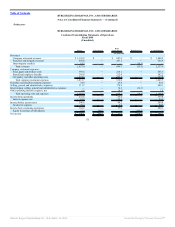
Table of Contents
BURGER KING HOLDINGS, INC. AND SUBSIDIARIES
Notes to Consolidated Financial Statements — (Continued)
Successor
BURGER KING CAPITAL HOLDINGS, LLC. AND SUBSIDIARIES
Condensed Consolidating Balance Sheets
As of December 31, 2011
(Unaudited)
BKH Issuers Eliminations Consolidated
(In millions)
ASSETS
Current assets:
Cash and cash equivalents $ 458.8 $ — $ — $ 458.8
Trade and notes receivable, net 152.8 — — 152.8
Prepaids and other current assets 68.0 1.2 — 69.2
Deferred income taxes, net 43.1 — — 43.1
Total current assets 722.7 1.2 — 723.9
Property and equipment, net 1,026.5 — — 1,026.5
Intangible assets, net 2,823.3 — — 2,823.3
Goodwill 657.7 — — 657.7
Net investment in property leased to franchisees 242.2 — — 242.2
Investment in subsidiaries — 1,449.2 (1,449.2) —
Other assets, net 111.1 18.9 — 130.0
Total assets $ 5,583.5 $ 1,469.3 $ (1,449.2) $ 5,603.6
LIABILITIES AND STOCKHOLDER’S EQUITY
Current liabilities:
Accounts and drafts payable $ 98.4 $ — $ — $ 98.4
Accrued advertising 97.4 — — 97.4
Other accrued liabilities 242.2 0.5 — 242.7
Current portion of long term debt and capital leases 33.5 — — 33.5
Total current liabilities 471.5 0.5 — 472.0
Term debt, net of current portion 2,585.9 424.4 — 3,010.3
Capital leases, net of current portion 95.4 — — 95.4
Other liabilities, net 366.2 — — 366.2
Deferred income taxes, net 615.3 — — 615.3
Total liabilities 4,134.3 424.9 — 4,559.2
Stockholder’s equity:
Additional paid-in capital 1,557.1 1,172.3 (1,557.1) 1,172.3
Retained earnings (accumulated deficit) 5.4 (14.6) (5.4) (14.6)
Accumulated other comprehensive loss (113.3) (113.3) 113.3 (113.3)
Total stockholder’s equity 1,449.2 1,044.4 (1,449.2) 1,044.4
Total liabilities and stockholder’s equity $ 5,583.5 $ 1,469.3 $ (1,449.2) $ 5,603.6
142
Source: Burger King Holdings Inc, 10-K, March 14, 2012 Powered by Morningstar® Document Research℠