Burger King 2011 Annual Report Download - page 135
Download and view the complete annual report
Please find page 135 of the 2011 Burger King annual report below. You can navigate through the pages in the report by either clicking on the pages listed below, or by using the keyword search tool below to find specific information within the annual report.-
 1
1 -
2
-
3
-
4
-
5
-
6
-
7
-
8
-
9
-
10
-
11
-
12
-
13
-
14
-
15
-
16
-
17
-
18
-
19
-
20
-
21
-
22
-
23
-
24
-
25
-
26
-
27
-
28
-
29
-
30
-
31
-
32
-
33
-
34
-
35
-
36
-
37
-
38
-
39
-
40
-
41
-
42
-
43
-
44
-
45
-
46
-
47
-
48
-
49
-
50
-
51
-
52
-
53
-
54
-
55
-
56
-
57
-
58
-
59
-
60
-
61
-
62
-
63
-
64
-
65
-
66
-
67
-
68
-
69
-
70
-
71
-
72
-
73
-
74
-
75
-
76
-
77
-
78
-
79
-
80
-
81
-
82
-
83
-
84
-
85
-
86
-
87
-
88
-
89
-
90
-
91
-
92
-
93
-
94
-
95
-
96
-
97
-
98
-
99
-
100
-
101
-
102
-
103
-
104
-
105
-
106
-
107
-
108
-
109
-
110
-
111
-
112
-
113
-
114
-
115
-
116
-
117
-
118
-
119
-
120
-
121
-
122
-
123
-
124
-
 125
125 -
 126
126 -
 127
127 -
 128
128 -
 129
129 -
 130
130 -
 131
131 -
 132
132 -
 133
133 -
 134
134 -
 135
135 -
 136
136 -
 137
137 -
 138
138 -
 139
139 -
 140
140 -
 141
141 -
 142
142 -
 143
143 -
 144
144 -
 145
145 -
146
-
147
-
148
-
149
-
150
-
151
-
152
 |
 |

Table of Contents
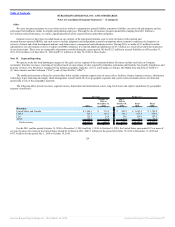
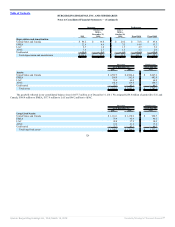
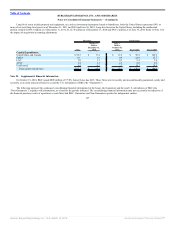
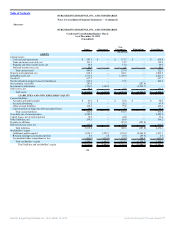
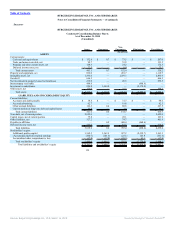
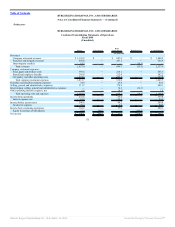
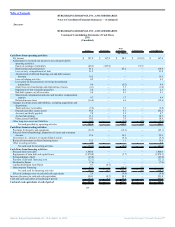
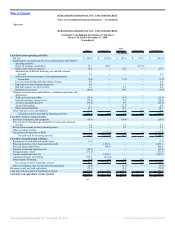
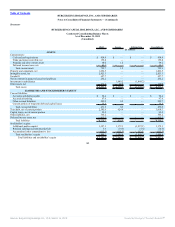
BURGER KING HOLDINGS, INC. AND SUBSIDIARIES
Notes to Consolidated Financial Statements — (Continued)
Predecessor
BURGER KING HOLDINGS, INC. AND SUBSIDIARIES
Condensed Consolidating Statements of Operations
Fiscal 2010
(Unaudited)
Issuer Guarantors
Non-
Guarantors Eliminations Consolidated
(In millions)
Revenues:
Company restaurant revenues $ 1,153.1 $ — $ 686.2 $ — $ 1,839.3
Franchise and property revenues 443.6 — 219.3 — 662.9
Intercompany royalties 6.0 — 6.6 (12.6) —
Total revenues 1,602.7 — 912.1 (12.6) 2,502.2
Company restaurant expenses:
Food, paper and product costs 373.6 — 211.4 — 585.0
Payroll and employee benefits 356.3 — 212.4 — 568.7
Occupancy and other operating costs 265.4 — 195.7 — 461.1
Total company restaurant expenses 995.3 — 619.5 — 1,614.8
Franchise and franchise property expenses 38.6 — 26.8 — 65.4
Selling, general and administrative expenses 297.7 — 192.1 — 489.8
Intercompany selling, general and administrative expenses 6.6 — 6.0 (12.6) —
Other operating (income) expense, net (0.5) — (0.2) — (0.7)
Total operating costs and expenses 1,337.7 — 844.2 (12.6) 2,169.3
Income from operations 265.0 — 67.9 — 332.9
Interest expense, net 36.6 — 12.0 — 48.6
Income before income taxes 228.4 — 55.9 — 284.3
Income tax expense 85.4 — 12.1 — 97.5
Income from continuing operations 143.0 — 43.8 — 186.8
Equity in earnings of subsidiaries 43.8 186.8 — (230.6) —
Net income $ 186.8 $ 186.8 $ 43.8 (230.6) $ 186.8
134
Source: Burger King Holdings Inc, 10-K, March 14, 2012 Powered by Morningstar® Document Research℠