Burger King 2011 Annual Report Download - page 33
Download and view the complete annual report
Please find page 33 of the 2011 Burger King annual report below. You can navigate through the pages in the report by either clicking on the pages listed below, or by using the keyword search tool below to find specific information within the annual report.-
 1
1 -
2
-
3
-
4
-
5
-
6
-
7
-
8
-
9
-
10
-
11
-
12
-
13
-
14
-
15
-
16
-
17
-
18
-
19
-
20
-
21
-
22
-
 23
23 -
 24
24 -
 25
25 -
 26
26 -
 27
27 -
 28
28 -
 29
29 -
 30
30 -
 31
31 -
 32
32 -
 33
33 -
 34
34 -
 35
35 -
 36
36 -
 37
37 -
 38
38 -
 39
39 -
 40
40 -
 41
41 -
 42
42 -
 43
43 -
44
-
45
-
46
-
47
-
48
-
49
-
50
-
51
-
52
-
53
-
54
-
55
-
56
-
57
-
58
-
59
-
60
-
61
-
62
-
63
-
64
-
65
-
66
-
67
-
68
-
69
-
70
-
71
-
72
-
73
-
74
-
75
-
76
-
77
-
78
-
79
-
80
-
81
-
82
-
83
-
84
-
85
-
86
-
87
-
88
-
89
-
90
-
91
-
92
-
93
-
94
-
95
-
96
-
97
-
98
-
99
-
100
-
101
-
102
-
103
-
104
-
105
-
106
-
107
-
108
-
109
-
110
-
111
-
112
-
113
-
114
-
115
-
116
-
117
-
118
-
119
-
120
-
121
-
122
-
123
-
124
-
125
-
126
-
127
-
128
-
129
-
130
-
131
-
132
-
133
-
134
-
135
-
136
-
137
-
138
-
139
-
140
-
141
-
142
-
143
-
144
-
145
-
146
-
147
-
148
-
149
-
150
-
151
-
152
 |
 |

Table of Contents
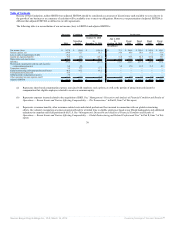
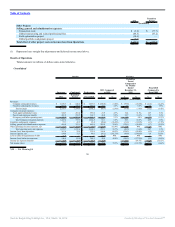
Burger King Holdings, Inc. and Subsidiaries Restaurant Count
The following table presents information relating to the analysis of our restaurant count for the geographic areas and periods indicated.
Successor Predecessor
December 31,
2011
December 31,
2010
December 31,
2009
June 30,
2010
June 30,
2009
Number of Company restaurants:
U.S. & Canada 939 984 1,029 987 1,043
EMEA 192 203 277 241 278
Latin America 97 96 94 97 92
APAC 67 61 22 62 16
Total Company restaurants 1,295 1,344 1,422 1,387 1,429
Number of franchise restaurants:
U.S. & Canada 6,561 6,566 6,516 6,562 6,491
EMEA 2,690 2,525 2,387 2,439 2,302
Latin America 1,125 1,044 1,011 1,041 986
APAC 841 772 742 745 717
Total franchise restaurants 11,217 10,907 10,656 10,787 10,496
Number of system-wide restaurants:
U.S. & Canada 7,500 7,550 7,545 7,549 7,534
EMEA 2,882 2,728 2,664 2,680 2,580
Latin America 1,222 1,140 1,105 1,138 1,078
APAC 908 833 764 807 733
Total system-wide restaurants 12,512 12,251 12,078 12,174 11,925
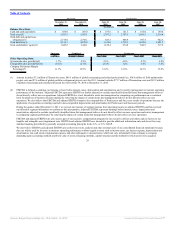
Item 7. Management’s Discussion and Analysis of Financial Condition and Results of Operations
You should read the following discussion together with Part II, Item 6 “Selected Financial Data” and our audited Consolidated Financial Statements and
the related notes thereto included in Item 8 “Financial Statements and Supplementary Data”. In addition to historical consolidated financial information, this
discussion contains forward-looking statements that reflect our plans, estimates and beliefs. Actual results could differ from these expectations as a result of
factors including those described under Item 1A, “Risk Factors,” “Special Note Regarding Forward-Looking Statements” and elsewhere in this report.
All references to 2011 in this section are to our fiscal year ended December 31, 2011. References to 2010 in this section are to the twelve months ended
December 31, 2010, derived by adding the unaudited results of operations of our Predecessor from January 1, 2010 to October 18, 2010 to our audited results of
operations from October 19, 2010 to December 31, 2010. All references to the Transition Period in this section are to the six months ended December 31, 2010,
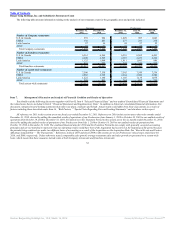
derived by adding the audited results of operations of our Predecessor from July 1, 2010 to October 18, 2010 to our audited results of operations from
October 19, 2010 to December 31, 2010. The combined financial data for 2010 and the Transition Period do not comply with generally accepted accounting
principles and are not intended to represent what our operating results would have been if the Acquisition had occurred at the beginning of the period because
the periods being combined are under two different bases of accounting as a result of the Acquisition on the Acquisition Date. See “Recent Events and Factors
Affecting Comparability — The Transactions.” References to fiscal 2010 and fiscal 2009 in this section are to our Predecessor’s fiscal years ended June 30,
2010, and 2009, respectively. Unless otherwise stated, comparable sales growth, average restaurant sales and sales growth are presented on a system-wide
basis, which means that these measures include sales at both Company restaurants and franchise restaurants.
32
Source: Burger King Holdings Inc, 10-K, March 14, 2012 Powered by Morningstar® Document Research℠