Burger King 2011 Annual Report Download - page 104
Download and view the complete annual report
Please find page 104 of the 2011 Burger King annual report below. You can navigate through the pages in the report by either clicking on the pages listed below, or by using the keyword search tool below to find specific information within the annual report.-
 1
1 -
2
-
3
-
4
-
5
-
6
-
7
-
8
-
9
-
10
-
11
-
12
-
13
-
14
-
15
-
16
-
17
-
18
-
19
-
20
-
21
-
22
-
23
-
24
-
25
-
26
-
27
-
28
-
29
-
30
-
31
-
32
-
33
-
34
-
35
-
36
-
37
-
38
-
39
-
40
-
41
-
42
-
43
-
44
-
45
-
46
-
47
-
48
-
49
-
50
-
51
-
52
-
53
-
54
-
55
-
56
-
57
-
58
-
59
-
60
-
61
-
62
-
63
-
64
-
65
-
66
-
67
-
68
-
69
-
70
-
71
-
72
-
73
-
74
-
75
-
76
-
77
-
78
-
79
-
80
-
81
-
82
-
83
-
84
-
85
-
86
-
87
-
88
-
89
-
90
-
91
-
92
-
93
-
 94
94 -
 95
95 -
 96
96 -
 97
97 -
 98
98 -
 99
99 -
 100
100 -
 101
101 -
 102
102 -
 103
103 -
 104
104 -
 105
105 -
 106
106 -
 107
107 -
 108
108 -
 109
109 -
 110
110 -
 111
111 -
 112
112 -
 113
113 -
 114
114 -
115
-
116
-
117
-
118
-
119
-
120
-
121
-
122
-
123
-
124
-
125
-
126
-
127
-
128
-
129
-
130
-
131
-
132
-
133
-
134
-
135
-
136
-
137
-
138
-
139
-
140
-
141
-
142
-
143
-
144
-
145
-
146
-
147
-
148
-
149
-
150
-
151
-
152
 |
 |

Table of Contents
BURGER KING HOLDINGS, INC. AND SUBSIDIARIES
Notes to Consolidated Financial Statements — (Continued)
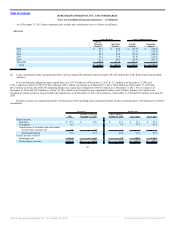
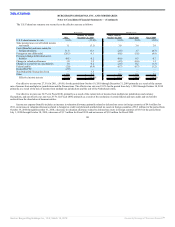
The tax effects of temporary differences that give rise to significant portions of the deferred tax assets and deferred tax liabilities are presented below (in
millions):
Successor Predecessor
As of December 31, As of June 30,
2011 2010
Fiscal
2010
Fiscal
2009
Deferred tax assets:
Trade and notes receivable, principally due to allowance for doubtful accounts $ 12.4 $ 16.9 $ 14.6 $ 12.7
Accrued employee benefits 48.2 54.0 63.8 49.6
Unfavorable leases 76.1 85.4 53.9 71.9
Liabilities not currently deductible for tax 40.0 6.4 42.2 52.7
Tax loss and credit carryforwards 121.5 115.8 138.5 111.3
Property and equipment, principally due to differences in depreciation — — 53.0 61.6
Other 1.5 2.5 3.4 3.4
Total gross deferred tax assets 299.7 281.0 369.4 363.2
Valuation allowance (99.6) (96.0) (74.6) (78.7)
Net deferred tax assets 200.1 185.0 294.8 284.5
Less deferred tax liabilities:
Property and equipment, principally due to differences in depreciation 6.5 13.7 — —
Intangible assets 632.8 621.7 249.7 237.3
Leases 124.4 136.0 53.1 55.1
Statutory Impairment 6.4 8.4 12.2 —
Total gross deferred tax liabilities 770.1 779.8 315.0 292.4
Net deferred tax liability $ 570.0 $ 594.8 $ 20.2 $ 7.9
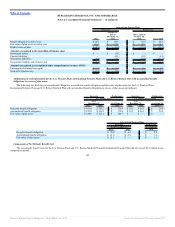
The valuation allowance increased by $3.6 million as a result of changes in the projected utilization of deferred tax assets in foreign jurisdictions and
currency fluctuations. For the Transition Period, the valuation allowance increased by $21.4 million primarily as a result of changes in the projected utilization of
foreign tax credits, deferred tax assets in foreign jurisdictions and changes in currency fluctuations. Of this increase, $18.3 million was recorded in goodwill as
part of the acquisition accounting adjustments.
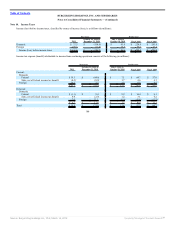
Changes in valuation allowance are as follows:
Successor Predecessor
2011
October 19, 2010 to
December 31, 2010
July 1, 2010 to
October 18, 2010
Fiscal 2010 Fiscal 2009
Beginning balance $ 96.0 $ 93.9 $ 74.6 $ 78.7 $ 87.9
Change in estimates recorded to deferred
income tax expense 4.6 3.3 (3.8) (1.7) 3.0
Changes from foreign currency exchange rates (1.0) (0.4) 4.8 (3.1) (11.9)
Other — (0.8) — 0.7 (0.3)
Ending balance $ 99.6 $ 96.0 $ 75.6 $ 74.6 $ 78.7
103
Source: Burger King Holdings Inc, 10-K, March 14, 2012 Powered by Morningstar® Document Research℠