Burger King 2011 Annual Report Download - page 54
Download and view the complete annual report
Please find page 54 of the 2011 Burger King annual report below. You can navigate through the pages in the report by either clicking on the pages listed below, or by using the keyword search tool below to find specific information within the annual report.-
 1
1 -
2
-
3
-
4
-
5
-
6
-
7
-
8
-
9
-
10
-
11
-
12
-
13
-
14
-
15
-
16
-
17
-
18
-
19
-
20
-
21
-
22
-
23
-
24
-
25
-
26
-
27
-
28
-
29
-
30
-
31
-
32
-
33
-
34
-
35
-
36
-
37
-
38
-
39
-
40
-
41
-
42
-
43
-
 44
44 -
 45
45 -
 46
46 -
 47
47 -
 48
48 -
 49
49 -
 50
50 -
 51
51 -
 52
52 -
 53
53 -
 54
54 -
 55
55 -
 56
56 -
 57
57 -
 58
58 -
 59
59 -
 60
60 -
 61
61 -
 62
62 -
 63
63 -
 64
64 -
65
-
66
-
67
-
68
-
69
-
70
-
71
-
72
-
73
-
74
-
75
-
76
-
77
-
78
-
79
-
80
-
81
-
82
-
83
-
84
-
85
-
86
-
87
-
88
-
89
-
90
-
91
-
92
-
93
-
94
-
95
-
96
-
97
-
98
-
99
-
100
-
101
-
102
-
103
-
104
-
105
-
106
-
107
-
108
-
109
-
110
-
111
-
112
-
113
-
114
-
115
-
116
-
117
-
118
-
119
-
120
-
121
-
122
-
123
-
124
-
125
-
126
-
127
-
128
-
129
-
130
-
131
-
132
-
133
-
134
-
135
-
136
-
137
-
138
-
139
-
140
-
141
-
142
-
143
-
144
-
145
-
146
-
147
-
148
-
149
-
150
-
151
-
152
 |
 |

Table of Contents
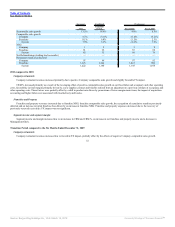
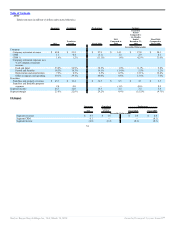
CRM % decreased primarily due to the impact of sales deleverage on our fixed labor and occupancy and other operating costs as a result of negative
Company comparable sales growth and higher utility costs, partially offset by changes in product mix and improved labor efficiencies.
Franchise and Property
Franchise and property revenues increased due to franchise NRG, franchise comparable sales growth, an increase in initial franchise fees primarily in
Brazil and favorable FX impact. Franchise and property expenses increased primarily as a result of an increase in bad debt expense.
Segment income and segment margin
Segment income increased primarily due to an increase in franchise and property income partially offset by a decrease in CRM.
Segment margin decreased due to a decrease in CRM % partially offset by the factors previously discussed.
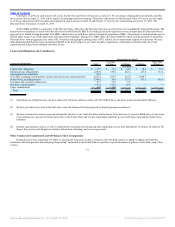
Fiscal 2010 compared to Fiscal 2009
Company restaurants
Company restaurant revenues increased due to Company NRG, partially offset by negative Company comparable sales growth and unfavorable FX impact.
CRM remained relatively unchanged.
Franchise and Property
Franchise and property revenues increased due to favorable FX impact and franchise NRG, partially offset by negative franchise comparable sales growth.
Franchise and property expenses were flat.
Segment income and segment margin
Segment income and margin remained relatively unchanged.
53
Source: Burger King Holdings Inc, 10-K, March 14, 2012 Powered by Morningstar® Document Research℠