Burger King 2011 Annual Report Download - page 137
Download and view the complete annual report
Please find page 137 of the 2011 Burger King annual report below. You can navigate through the pages in the report by either clicking on the pages listed below, or by using the keyword search tool below to find specific information within the annual report.-
 1
1 -
2
-
3
-
4
-
5
-
6
-
7
-
8
-
9
-
10
-
11
-
12
-
13
-
14
-
15
-
16
-
17
-
18
-
19
-
20
-
21
-
22
-
23
-
24
-
25
-
26
-
27
-
28
-
29
-
30
-
31
-
32
-
33
-
34
-
35
-
36
-
37
-
38
-
39
-
40
-
41
-
42
-
43
-
44
-
45
-
46
-
47
-
48
-
49
-
50
-
51
-
52
-
53
-
54
-
55
-
56
-
57
-
58
-
59
-
60
-
61
-
62
-
63
-
64
-
65
-
66
-
67
-
68
-
69
-
70
-
71
-
72
-
73
-
74
-
75
-
76
-
77
-
78
-
79
-
80
-
81
-
82
-
83
-
84
-
85
-
86
-
87
-
88
-
89
-
90
-
91
-
92
-
93
-
94
-
95
-
96
-
97
-
98
-
99
-
100
-
101
-
102
-
103
-
104
-
105
-
106
-
107
-
108
-
109
-
110
-
111
-
112
-
113
-
114
-
115
-
116
-
117
-
118
-
119
-
120
-
121
-
122
-
123
-
124
-
125
-
126
-
 127
127 -
 128
128 -
 129
129 -
 130
130 -
 131
131 -
 132
132 -
 133
133 -
 134
134 -
 135
135 -
 136
136 -
 137
137 -
 138
138 -
 139
139 -
 140
140 -
 141
141 -
 142
142 -
 143
143 -
 144
144 -
 145
145 -
 146
146 -
 147
147 -
148
-
149
-
150
-
151
-
152
 |
 |

Table of Contents
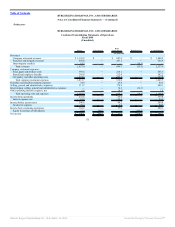
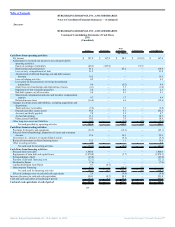
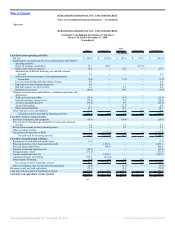
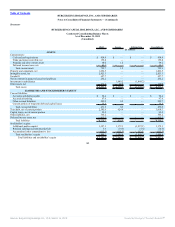
BURGER KING HOLDINGS, INC. AND SUBSIDIARIES
Notes to Consolidated Financial Statements — (Continued)
Successor
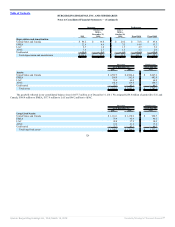
BURGER KING HOLDINGS, INC. AND SUBSIDIARIES
Condensed Consolidating Statements of Cash Flows
2011
(Unaudited)
Issuer Guarantor
Non-
Guarantor Eliminations Consolidated
(In millions)
Cash flows from operating activities:
Net income $ 107.0 $ 107.0 $ 88.5 $ (195.5) $ 107.0
Adjustments to reconcile net income to net cash provided by
operating activities:
Equity in earnings of subsidiary (88.5) (107.0) — 195.5 —
Depreciation and amortization 91.2 — 45.2 — 136.4
Loss on early extinguishment of debt 21.4 — — — 21.4
Amortization of deferred financing cost and debt issuance
discount 14.5 — — — 14.5
Loss on hedging activities 0.5 — — — 0.5
Loss (gain) on remeasurement of foreign denominated
transactions 0.6 — (0.2) — 0.4
(Gain) loss on refranchisings and dispositions of assets (4.1) — 3.1 (1.0)
Impairment of non-restaurant properties 2.0 — 0.3 — 2.3
Bad debt expense, net of recoveries 6.0 — 0.1 — 6.1
Share-based compensation and non-cash incentive compensation
expense 4.7 — 1.7 6.4
Deferred income taxes (36.8) — 6.4 — (30.4)
Changes in current assets and liabilities, excluding acquisitions and
dispositions:
Trade and notes receivables (9.6) — 3.6 — (6.0)
Prepaids and other current assets 96.4 — 9.1 — 105.5
Accounts and drafts payable 2.8 — 5.9 — 8.7
Accrued advertising 11.3 — 7.0 — 18.3
Other accrued liabilities 10.5 — 7.9 — 18.4
Other long-term assets and liabilities 12.3 — (9.7) (4.9) (2.3)
Net cash provided by operating activities 242.2 — 168.9 (4.9) 406.2
Cash flows from investing activities:
Payments for property and equipment (62.5) — (19.6) — (82.1)
Proceeds from refranchisings, disposition of assets and restaurant
closures 15.6 — 14.3 — 29.9
Investments in / advances to unconsolidated entities — — (4.5) — (4.5)
Return of investment on direct financing leases 13.5 — 1.1 — 14.6
Other investing activities 0.7 — — — 0.7
Net cash used for investing activities (32.7) — (8.7) — (41.4)
Cash flows from financing activities:
Proceeds from term debt 1,860.0 — — — 1,860.0
Repayments of term debt and capital leases (1,870.8) — (3.7) — (1,874.5)
Extinguishment of debt (63.0) (63.0)
Payment of deferred financing costs (23.1) — — — (23.1)
Dividend to Parent (7.6) — — — (7.6)
Capital distribution from Parent 0.7 (0.7) — — —
Intercompany Financing 43.6 — (48.5) 4.9 —
Net cash used for financing activities (60.2) (0.7) (52.2) 4.9 (108.2)
Effect of exchange rates on cash and cash equivalents 5.0 (9.8) — (4.8)
Increase (decrease) in cash and cash equivalents 154.3 (0.7) 98.2 — 251.8
Cash and cash equivalents at beginning of period 132.8 0.7 73.5 — 207.0
Cash and cash equivalents at end of period $ 287.1 $ — $ 171.7 $ — $ 458.8
136
Source: Burger King Holdings Inc, 10-K, March 14, 2012 Powered by Morningstar® Document Research℠