ICICI Bank 2009 Annual Report Download - page 94
Download and view the complete annual report
Please find page 94 of the 2009 ICICI Bank annual report below. You can navigate through the pages in the report by either clicking on the pages listed below, or by using the keyword search tool below to find specific information within the annual report.-
 1
1 -
2
-
3
-
4
-
5
-
6
-
7
-
8
-
9
-
10
-
11
-
12
-
13
-
14
-
15
-
16
-
17
-
18
-
19
-
20
-
21
-
22
-
23
-
24
-
25
-
26
-
27
-
28
-
29
-
30
-
31
-
32
-
33
-
34
-
35
-
36
-
37
-
38
-
39
-
40
-
41
-
42
-
43
-
44
-
45
-
46
-
47
-
48
-
49
-
50
-
51
-
52
-
53
-
54
-
55
-
56
-
57
-
58
-
59
-
60
-
61
-
62
-
63
-
64
-
65
-
66
-
67
-
68
-
69
-
70
-
71
-
72
-
73
-
74
-
75
-
76
-
77
-
78
-
79
-
80
-
81
-
82
-
83
-
 84
84 -
 85
85 -
 86
86 -
 87
87 -
 88
88 -
 89
89 -
 90
90 -
 91
91 -
 92
92 -
 93
93 -
 94
94 -
 95
95 -
 96
96 -
 97
97 -
 98
98 -
 99
99 -
 100
100 -
 101
101 -
 102
102 -
 103
103 -
 104
104 -
105
-
106
-
107
-
108
-
109
-
110
-
111
-
112
-
113
-
114
-
115
-
116
-
117
-
118
-
119
-
120
-
121
-
122
-
123
-
124
-
125
-
126
-
127
-
128
-
129
-
130
-
131
-
132
-
133
-
134
-
135
-
136
-
137
-
138
-
139
-
140
-
141
-
142
-
143
-
144
-
145
-
146
-
147
-
148
-
149
-
150
-
151
-
152
-
153
-
154
-
155
-
156
-
157
-
158
-
159
-
160
-
161
-
162
-
163
-
164
-
165
-
166
-
167
-
168
-
169
-
170
-
171
-
172
-
173
-
174
-
175
-
176
-
177
-
178
-
179
-
180
 |
 |

F20
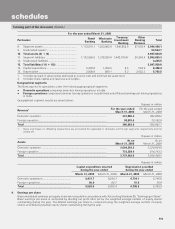
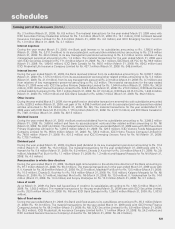
The computation of earnings per share is given below:
Rupees in million, except per share data
Year ended
March 31, 2009 Year ended
March 31, 2008
Basic
Weighted average number of equity shares outstanding ..................................... 1,113,129,213 1,055,591,068
Net profit ................................................................................................................ 37,581.3 41,577.3
Basic earnings per share (Rs.) ............................................................................... 33.76 39.39
Diluted
Weighted average number of equity shares outstanding ..................................... 1,115,328,034 1,062,103,167
Net profit ................................................................................................................ 37,581.3 41,577.3
Diluted earnings per share (Rs.) ............................................................................. 33.70 39.15
Nominal value per share (Rs.) ................................................................................ 10.00 10.00
The dilutive impact is due to options granted to employees by the Bank.
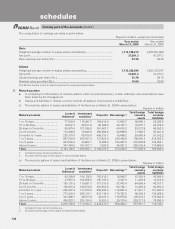
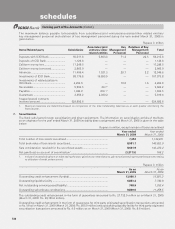
5. Maturity pattern
In compiling the information of maturity pattern (refer 5 (a) and (b) below), certain estimates and assumptions have
been made by the management.
Assets and liabilities in foreign currency exclude off-balance sheet assets and liabilities.
a) The maturity pattern of assets and liabilities of the Bank as on March 31, 2009 is given below: Rupees in million
Maturity buckets Loans &
Advances1Investment
securities1Deposits1Borrowings1,2 Total foreign
currency
assets
Total foreign
currency
liabilities
1 to 14 days ................................. 77,002.6 116,387.7 159,613.6 17,960.7 92,686.3 52,220.8
15 to 28 days ............................... 18,547.3 45,611.8 80,388.8 20,197.7 12,581.7 26,476.9
29 days to 3 months ................... 95,975.6 101,038.8 381,487.7 44,676.2 20,572.8 68,052.0
3 to 6 months .............................. 112,396.9 74,045.9 356,088.8 58,999.8 17,960.5 55,441.0
6 months to 1 year ...................... 220,770.0 99,709.9 458,313.7 76,648.2 29,985.6 87,612.2
1 to 3 years .................................. 887,376.0 260,527.2 731,623.0 240,446.0 156,996.3 215,855.3
3 to 5 years .................................. 423,545.6 25,850.1 14,368.4 165,287.0 219,948.8 164,054.1
Above 5 years .............................. 347,494.5 307,411.7 1,594.2 49,021.3 226,356.6 110,888.5
Total ............................................ 2,183,108.5 1,030,583.1 2,183,478.2 673,236.9 777,088.6 780,600.8
1. Includes foreign currency balances.
2. Excludes borrowings in the nature of sub-ordinated debts.
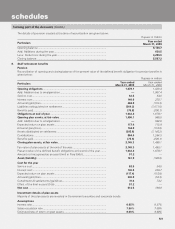
b) The maturity pattern of assets and liabilities of the Bank as on March 31, 2008 is given below: Rupees in million
Maturity buckets Loans &
Advances1Investment
securities1Deposits1Borrowings1,2 Total foreign
currency
assets
Total foreign
currency
liabilities
1 to 14 days ................................. 93,299.9 144,138.8 150,415.1 18,949.7 67,356.4 49,954.8
15 to 28 days ............................... 27,857.4 102,926.6 105,105.3 5,407.0 11,229.6 12,310.0
29 days to 3 months ................... 155,107.3 110,681.3 377,315.6 37,476.4 64,606.8 60,017.7
3 to 6 months .............................. 156,415.2 106,274.8 353,452.6 98,782.1 31,405.6 82,855.8
6 months to 1 year ...................... 260,207.4 171,675.0 596,599.9 112,847.4 61,401.7 121,563.8
1 to 3 years .................................. 773,243.4 208,115.1 812,119.4 176,727.5 66,300.5 143,269.2
3 to 5 years .................................. 331,808.1 46,577.8 34,047.3 176,974.8 125,974.1 170,063.8
Above 5 years .............................. 458,222.1 224,154.0 15,255.3 29,319.4 229,717.0 74,283.0
Total ............................................ 2,256,160.8 1,114,543.4 2,444,310.5 656,484.3 657,991.7 714,318.1
1. Includes foreign currency balances.
2. Excludes borrowings in the nature of subordinated debts.
forming part of the Accounts (Contd.)
schedules