ICICI Bank 2009 Annual Report Download - page 57
Download and view the complete annual report
Please find page 57 of the 2009 ICICI Bank annual report below. You can navigate through the pages in the report by either clicking on the pages listed below, or by using the keyword search tool below to find specific information within the annual report.-
 1
1 -
2
-
3
-
4
-
5
-
6
-
7
-
8
-
9
-
10
-
11
-
12
-
13
-
14
-
15
-
16
-
17
-
18
-
19
-
20
-
21
-
22
-
23
-
24
-
25
-
26
-
27
-
28
-
29
-
30
-
31
-
32
-
33
-
34
-
35
-
36
-
37
-
38
-
39
-
40
-
41
-
42
-
43
-
44
-
45
-
46
-
 47
47 -
 48
48 -
 49
49 -
 50
50 -
 51
51 -
 52
52 -
 53
53 -
 54
54 -
 55
55 -
 56
56 -
 57
57 -
 58
58 -
 59
59 -
 60
60 -
 61
61 -
 62
62 -
 63
63 -
 64
64 -
 65
65 -
 66
66 -
 67
67 -
68
-
69
-
70
-
71
-
72
-
73
-
74
-
75
-
76
-
77
-
78
-
79
-
80
-
81
-
82
-
83
-
84
-
85
-
86
-
87
-
88
-
89
-
90
-
91
-
92
-
93
-
94
-
95
-
96
-
97
-
98
-
99
-
100
-
101
-
102
-
103
-
104
-
105
-
106
-
107
-
108
-
109
-
110
-
111
-
112
-
113
-
114
-
115
-
116
-
117
-
118
-
119
-
120
-
121
-
122
-
123
-
124
-
125
-
126
-
127
-
128
-
129
-
130
-
131
-
132
-
133
-
134
-
135
-
136
-
137
-
138
-
139
-
140
-
141
-
142
-
143
-
144
-
145
-
146
-
147
-
148
-
149
-
150
-
151
-
152
-
153
-
154
-
155
-
156
-
157
-
158
-
159
-
160
-
161
-
162
-
163
-
164
-
165
-
166
-
167
-
168
-
169
-
170
-
171
-
172
-
173
-
174
-
175
-
176
-
177
-
178
-
179
-
180
 |
 |

55Annual Report 2008-2009
The Power of Belief
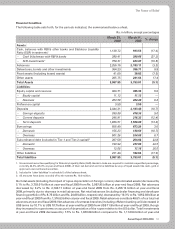
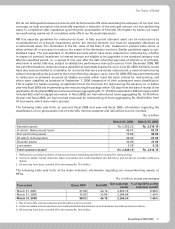
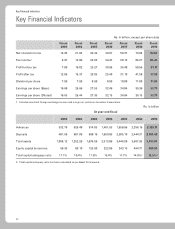
The following tables set forth, at the dates indicated, the composition of our gross advances (net of write-offs).
Rs. in billion, except percentages
March 31, 2008 March 31, 2009
Total
advances % of total
advances Total
advances % of total
advances
Retail finance11,347.54 58.6 1,102.20 49.3
Services – non finance 145.57 6.3 168.05 7.5
Crude petroleum/refining & petrochemicals 58.21 2.5 142.04 6.4
Iron/steel & products 93.23 4.1 99.14 4.4
Road, port, telecom, urban development & other infrastructure 51.45 2.2 94.62 4.2
Services – finance 66.18 2.9 77.68 3.5
Power 58.08 2.5 54.19 2.4
Food & beverages 63.32 2.8 53.57 2.4
Chemical & fertilisers 38.06 1.7 51.83 2.3
Electronics & engineering 20.82 0.9 36.17 1.6
Wholesale/retail trade 25.26 1.1 26.29 1.2
Construction 29.36 1.3 23.86 1.1
Other industries2301.84 13.1 306.57 13.7
Total 2,298.92 100.0% 2,236.21 100.0%
1. Includes home loans, automobile loans, commercial business loans, two wheeler loans, personal loans and credit cards. It also
includes dealer funding portfolio of Rs. 8.83 billion (Rs. 24.10 billion at year-end fiscal 2008) and developer financing of Rs. 24.14
billion (Rs. 27.79 billion at year-end fiscal 2008).
2. Other industries primarily include automobiles, cement, drugs & pharmaceuticals, agriculture & allied activities, FMCG, gems &
jewellery, manufacturing products excluding metal, metal & metal products (excluding iron & steel), mining, shipping, textiles etc.
The following table sets forth, at the dates indicated, the composition of our gross (net of write-offs) outstanding
retail finance portfolio.
Rs. in billion, except percentages
March 31, 2008 March 31, 2009
Total retail
advances % of total
retail advances Total retail
advances % of total
retail advances
Home loans1664.39 49.3 575.88 52.2
Automobile loans 174.66 13.0 133.05 12.1
Commercial business 203.71 15.1 164.40 14.9
Two-wheeler loans 29.81 2.2 16.91 1.5
Personal loans 144.13 10.7 108.66 9.9
Credit cards 96.45 7.2 90.02 8.2
Loans against securities & others234.39 2.5 13.28 1.2
Total retail finance portfolio 1,347.54 100.0% 1,102.20 100.0%
1. Includes developer financing of Rs. 27.79 billion and Rs. 24.14 billion at year-end fiscal 2008 and year-end fiscal 2009 respectively.
2. Includes dealer financing portfolio of Rs. 24.10 billion and Rs. 8.83 billion at year-end fiscal 2008 and year-end fiscal 2009
respectively.
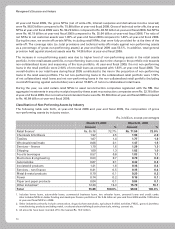
Pursuant to the guidelines of RBI, our exposure to an individual borrower must not exceed 15.0% of our capital
funds, comprising Tier-1 and Tier-2 capital calculated pursuant to the guidelines of RBI. Exposure to individual
borrowers may exceed the exposure norm of 15.0% of capital funds by an additional 5.0% (i.e. up to 20.0%)
provided the additional exposure is on account of infrastructure financing. Our exposure to a group of companies
under the same management control must not exceed 40.0% of our capital funds unless the exposure is in respect
of an infrastructure project. In case of infrastructure projects, the exposure to a group of companies under the
same management control may be up to 50.0% of our capital funds. Banks may, in exceptional circumstances,
with the approval of their boards, enhance the exposure by 5.0% of capital funds (i.e. 20.0% of capital funds for
an individual borrower and 45.0% of capital funds for a group of companies under same management), making